RISK MANAGEMENT
The environment, in which the Bank operates in, is changing at a faster rate than usual with changing global geopolitical, economic and technological landscape and is further complicated by ever evolving regulatory environment. This new norm requires banks to enhance risk management capabilities and insights to facilitate more robust and better risk decision making processes, to ensure that the Bank continues to create value to business partners, whilst ensuring resilience to weather the storm of change.
The Bank is currently going through an intense change program known as Transformation 2020 (T20), to become one of the largest banks in Sri Lanka by 2020, increasing balance sheet size and significantly growing stakeholder returns. With evolving business complexity and needs, Group Risk keeps abreast with trends and challenges of risk management to better support the Bank and its Group companies in meeting its strategic and business objectives.
THE RISK PROFILE OF THE BANK AT A GLANCE
 Diversified Portfolio
-
The Bank has a well-diversified portfolio of loans and receivables and income streams across geographies, industry sectors and products.
-
The Bank holds a diverse mix of collateral, valued conservatively.
-
The Bank’s top corporate exposures are stable as a proportion of capital resources and highly diversified.
-
The Bank’s asset quality remains sound.
 Prudent Capital & Liquidity Position
-
The Bank remains adequately capitalized under Basel III requirements and the Bank’s Statement of Financial Position remains liquid.
-
The Bank’s customer deposit base is diversified and is growing.
-
The Bank has a substantial portfolio of high quality liquid assets that can be realized if a liquidity stress occurs which is reflected by maintenance of a Liquidity Coverage Ratio well above the regulatory requirements. The Bank maintains the Liquid Assets Ratio at prudent level.
-
Apart from the regulatory limits, the Bank has set internal prudential Liquidity ratios and Position limits for proactive Liquidity Management.
 Robust Risk Governance Structure & Experienced Team
-
The Bank has a clear statement of risk appetite which is aligned to the Bank’s strategy and is approved by the Board.
-
The Bank continuously monitors its risk profile to ensure it remains within the risk appetite and regularly conducts stress tests.
-
The Bank reviews and adjusts exposures, underwriting standards and limits in response to observed and anticipated changes in the environment and expectations.
-
The Bank has a very experienced risk team.
-
The Bank has a robust risk management framework which assigns accountability and responsibility for the management and control of risk.
2017 - KEY ACHIEVEMENTS
Establishment of a Board Credit Committee
A Board Credit Committee was formed to further strengthen the credit approval process of the Bank.
Automation of Operational Risk Management Process
Automation facilitates incident/loss event reporting, Risk and Control Self- Assessment (RCSA), Key Risk Indicators (KRIs), Scenario Analysis etc.
Pricing to Reflect Additional Costs of Business
RORAC model revisited in line with increase in Basel III capital requirements.
Risk Models to Support Decision Making
New score card developed statistically based on Bank’s own default experience for Personal Loans to support decision making.
Independent third party validation of risk models carried out based on the Board approved Model Validation Policy.
Basel III Compliance
Group wide risk appetite framework put in place to define the boundaries and drivers of doing business
2018 – OUR PRIORITIES
SLFRS 9 Compliance
Maximize capital utilization
Risk profiling and Scenario based stress testing for Operational Risk
Further strengthening of risk and compliance culture across the Group
Continuing to develop risk talent across the Group Risk Management department
Review and manage Risk Appetite in line with T20 strategy
In the current operating environment, the key to a sustainable business and enduring growth hinges considerably on a bank’s ability to spot and react swiftly to threats and opportunities ahead of other competitors. With this in mind, Group Risk is steadfast in playing a vital role through closer collaboration with business and other functions of the Bank and the Group to meet the shifts in expectations of the myriad of stakeholders (i.e. employees, customers, regulators, shareholders, business partners), while staying vigilant by having the necessary mitigating actions to pro-actively manage risks.
EXTERNAL DRIVERS - IMPACT & RESPONSE

Growth/Performance of World Economy & Local Economy
The Bank monitors these trends carefully to support decision making at operational and strategic levels.

Geo Political Events
The Bank actively monitors situations that could have an impact and conducts regular stress tests of the impact of such events on portfolios.

Monetary Policy, Market Conditions & Economic Climate
Monetary Policy changes and Market conditions will effect the Bank performance. Thus, these are monitored closely to manage risk and exploit opportunities through dynamic Asset and Liability Management.

Changes in Regulatory Environment
The Bank reviews key regulatory developments in order to anticipate changes and their potential impact on performance. The Bank responds both unilaterally and through participation in industry groups to consultation papers and discussions initiated by regulators. The focus of these activities is to develop the framework for a stable and sustainable financial sector and economy. The nature and impact of changes in economic policies, laws and regulations are monitored and considered in the way the Bank conducts business and manages capital and liquidity.

Cyber Threats
The Bank having understood the importance of managing the cyber risk has deployed technical controls to mitigate cyber risk such as multi-layer firewalls, network separation, implementation of intrusion prevention systems, gateway level content filtering, anti-malware solutions and updates to operating systems.
In addition to the above, Bank has subscribed to the services provided by Financial Sector Computer Security Incident Response Team (FINCSIRT), where latest threat intelligence to the Banking industry is provided to IT security team of the Bank to take proactive steps to address the potential exposures. The Bank’s IT policies and procedures are aligned with Baseline Security Standards Guidelines issued by the Central Bank of Sri Lanka. The Bank has also conducted penetration testing exercise by employing an external service provider to test the resilience of systems.
RISK MANAGEMENT APPROACH
The Bank’s risk management is underpinned by a comprehensive, Integrated Risk Management Framework, which is constantly evolving and enhancing to remain relevant and most effective. The framework which is approved by the Board spells out the Bank’s approach to Risk Management. The framework sets out the process of identifying, measuring, monitoring and controlling the different types of risks and the risk governance structure in place. The main objectives of the framework are;
-
To establish common principles, standards for the management and control of all risks and to inform behaviour across the Bank.
-
Provide a shared framework and language to improve awareness of risk management processes among all stakeholders.
-
To provide clear accountability and responsibility for Risk Management.
-
To ensure consistency throughout the Bank in Risk Management.
-
Define the Bank’s risk appetite and align its portfolios and business strategy accordingly.
-
Optimize risk return decisions.
-
Maintain/manage the Bank’s capital adequacy and liquidity position.
-
Further strengthen governance, controls and accountability across the organization.
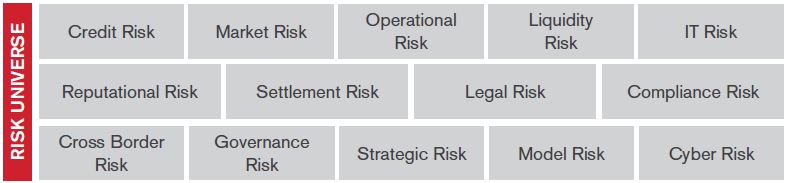
In addition to the main risks (viz. Credit Risk, Market Risk and Operational Risk), the Bank has considered several other risks which are material to it. These additional risk categories include, Liquidity Risk, Interest Rate Risk in the Banking Book, Underestimation of Credit Risk in Standardized Approach, Residual Credit Risk, Concentration Risk, Compliance Risk, Legal Risk, Strategic Risk, Governance Risk, Cross-border Risk, Settlement Risk, Reputational Risk, Model Risk and Group Risk.
The Bank's risk management framework is employed at all levels of the organization, and is instrumental in aligning the behaviour of individuals with the overall attitude to assuming and managing risk and ensuring that Bank’s risk profile is aligned to its risk appetite.
Risk Management at the Bank is underpinned by a set of key principles which serves as the foundation of the Bank’s risk management framework.
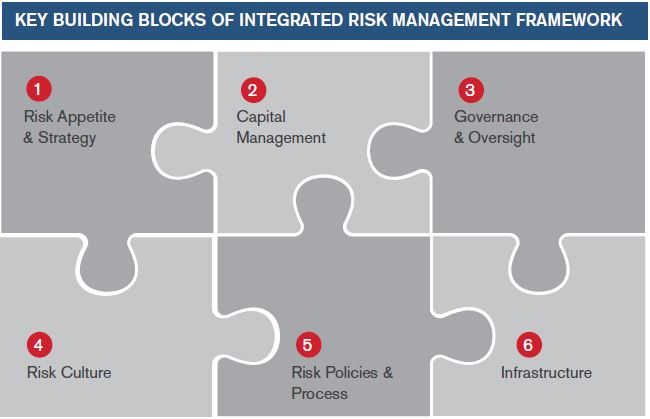
1
Establishment of a risk appetite and strategy which articulates the nature, type and level of risk, the Bank is willing to assume and is approved by the Board.
2
Capital management driven by the Bank’s strategic objectives and accounts for the relevant regulatory, economic and commercial environments in which the Bank operates.
3
Proper governance and oversight through a clear, effective and robust governance structure with well-defined, transparent and consistent lines of responsibility established.
4
Promotion of a strong risk culture that supports and provides appropriate standards and incentives for professional and responsible behavior.
5
Implementation of policies to ensure that risk management practices and processes are effective at all levels and execution of sound risk management processes to actively identify, measure, control, monitor and report risks inherent in all products, activities, processes, systems and exposures.
6
Ensure sufficient resources and systems infrastructure are in place to enable
effective
risk management.
Risk Appetite & Strategy
Risk Appetite is defined as the quantum of risk the Bank is willing to assume in different areas of business in achieving its strategic objectives and ensuring maintenance of desired risk profile. The Risk Appetite framework and Risk Tolerance limits have been defined by the Board in consultation with the Senior Management of the Bank in line with the Bank’s overall business strategy, providing clear direction to the business units for on-going operations and risk management. The Risk Appetite framework and Risk Tolerance limits are reviewed and adjusted by the Board when required based on developments in the operating environment.
In the event the risk appetite threshold has been breached, risk management and business controls are implemented to bring the exposure level back within the accepted range. Risk appetite, thus, translates into operational measures such as limits or qualitative checkpoints for the dimensions of capital, earnings volatility and concentration risk etc. In order to effectively implement risk appetite, the Bank has defined quantitative indicators (e.g., capital adequacy level and risk limits) or qualitatively embedded same in the policies and procedures (e.g., underwriting criteria).
Capital Management
Effective capital management is fundamental to the sustainability of the Bank. As such, the Bank pro-actively manages its capital position, capital mix and capital allocation to meet the expectations of key stakeholders such as regulators, shareholders, investors and rating agencies. Capital helps protect individual banks from insolvency, thereby promoting safety and soundness in the overall banking system. The Bank’s approach to capital management is driven by strategic objectives and guided by the Basel principles.
BASEL lll Framework
The Central Bank of Sri Lanka (CBSL) issued guidelines this year on Capital Requirements Basel III requiring banks to comply with same from 1 July 2017. Basel III capital standards endeavour to strengthen the quantity and quality of capital in banks. The Bank is fully compliant with these requirements. Details of compliance under each pillar are discussed below.
Pillar I – Minimum Capital Requirement
The objective of minimum capital requirements
under Pillar I of the Basel III framework is to
ensure that banks hold sufficient capital for
Credit, Market and Operational Risks. The
Bank is currently using the Standardized
Approach for minimum capital computation for
Credit Risk, the Standardized Measurement
Approach for minimum capital computation for
Market Risk and Basic Indicator Approach for
minimum capital computation for Operational
Risk. The Bank continues to maintain capital
well above the minimum requirement set by
the CBSL.
Credit Risk - With the intention of eventually moving to Internal Rating Based approaches the Bank rolled out rating models with the assistance of CRISIL Risk and Infrastructure Solutions Limited, India in 2014. CBSL is yet to issue guidelines for banks on Advanced Approaches of capital computation under Credit Risk.
Market Risk - The Bank has already rolled out its VaR models and will consider moving to advanced approach of capital computation for Market Risk on receipt of guidelines from the regulator.
Operational Risk - The Bank had been computing capital requirements in parallel as per The Standardized Approach (TSA) and Alternative Standardized Approach (ASA). The Bank forwarded a formal application to the CBSL requesting to grant approval to move to ASA after analyzing both advanced approaches (TSA & ASA) in considering the cost saving against the currently used Basic Indicator Approach (BIA).
Pillar ll – Supervisory Review Process
Minimum regulatory capital requirements
under Pillar l establishes regulatory capital
thresholds that banks should meet. The
Pillar II (Supervisory Review Process - SRP)
requires banks to implement an internal
process, called the Internal Capital Adequacy Assessment Process (ICAAP), for assessing
capital adequacy in relation to the risk
profiles as well as a strategy for maintaining
capital levels. The Pillar ll also requires
the supervisory authorities to subject all
banks to an evaluation process/Supervisory
Review Process (SRP), and to initiate such
supervisory measures, as might be considered
necessary. The Bank has in place an ICAAP
and has adhered to same from January 2013.
The ICAAP process has strengthened the risk
management practices and capital planning
process of the Bank.
The capital adequacy management framework serves to ensure that the Bank and its group entities are adequately capitalized in line with the risk profile, regulatory requirements and target ratios approved by the Board and to promote efficient use of capital to meet business requirements, strategic growth and shareholder return. The management framework further focuses on the financial ability of the Bank to absorb any potential losses that it might incur under varying market and economic conditions.
The Bank’s capital management objectives can be summarized as follows:
-
Maintain sufficient capital to meet minimum regulatory capital requirements
-
Hold sufficient capital to support the Banks’ risk appetite
-
Allocate capital to businesses to support the Bank and its group companies strategic objectives
-
Ensure that the Bank maintains capital in order to withstand the impact of potential stress events.
The Bank identified seventeen risks as material in line with the strategic plan. The choice is based on directions given by CBSL and self-assessment of most important risk categories which need a separate mention from an ICAAP perspective. The seventeen material risks identified are Credit Risk, Market Risk, Operational Risk, Concentration Risk, Interest Rate Risk in Banking Book, Liquidity Risk, Under-estimation of Credit Risk, Residual Risk, Strategic Risk, Reputational Risk, Legal Risk, Compliance Risk, Governance Risk, Model Risk, Settlement Risk, Group Risk and Cross-border Risk. These risk categories and their assessments are covered in detail in the ICAAP of the Bank.
The annual Capital Planning Process involves detailed planning of the strategic capital plan over at least a three-year horizon. The plan highlights the capital projections, capital requirements, levels of capital and capital mix to support the Bank’s business plan and strategic objectives. The Bank manages its capital structure and adjusts it accordingly in line with changes in local and global economic and market conditions and its overall risk appetite. Notwithstanding same, the projected capital plan is prepared considering mainly the organic growth, which assures adequate capital for the Bank for the next 3 years. The Bank and the Group would have the option to raise capital under normal and stressed scenarios by way of equity / capital infusion, issue of innovative perpetual debt instrument, issue of subordinated bonds or Hybrid capital instruments.
The Bank will continue to be proactive in its efficient utilization of capital and will constantly monitor ongoing developments affecting regulatory capital requirements as well as related capital market developments. The Bank is also committed to ensure continuous healthy capital levels with an optimal capital mix to support the Bank’s and the Group's strategic agenda and simultaneously maximizes value to shareholders.
The Bank has in place a comprehensive Stress Testing Policy and Framework in line with the regulatory guidelines as well as international best practices. The policy describes the purpose of stress testing and governance structure and the methodology for formulating stress tests whilst the framework specifies in detail the Stress Testing program including the stress tests, frequencies, assumptions, tolerance limits and remedial action.
Stress tests are conducted on standalone and consolidated basis at various frequencies in line with the Board approved framework and details of those are reported to Board IRMC. The outcome of the stress testing process is monitored carefully and remedial actions are taken in case of breaches. Further, stress testing is used by the Bank as a tool to supplement other risk management approaches.
The Stress Tests carried out as at 31.12.2017 are given below.
|
Credit Risk |
|
Impact of increase in the Non-Performing Assets on Capital Adequacy Ratio (CAR) |
|
Impact of change in Impairment on CAR |
|
Impact of default of Large Borrowers on CAR |
|
Credit Concentration Risk |
|
Impact of default by the Largest Group on CAR |
|
Impact of default in Specific Sector/Region on CAR |
|
Interest Rate Risk |
|
Impact of change in Interest Rates - Trading Book (Debt Securities) |
|
Impact of change in Interest Rates on CAR for Banking Book |
|
Exchange Rate Risk |
|
Impact of Exchange Rate movements of the Bank's (DBU and FCBU) Net Open position on CAR |
|
Impact of Exchange Rate movements of the Domestic Banking Unit (DBU) Net Open position on Profits |
|
Liquidity Risk |
|
Market Specific Stress Test - Adverse impact on Money Market & Institutional Borrowings/ Drop in Market Liquidity – DBU/FCBU on Liquid Asset Ratio (LAR) |
|
Bank Specific - Run down on CASA & Time Deposits –DBU/FCBU on LAR |
|
Market / Bank Specific - Adverse Impact on Total Liquid Liabilities – DBU/FCBU on LAR |
|
Impact of loss of large depositors on LAR |
|
Impact on CAR due to higher interest paid in a deposit run off scenario |
|
Combined Stress Test |
Pillar lll – Disclosures
The Bank provides enhanced quantitative and qualitative disclosures in line with the Basel III requirements in the Annual Report, website and press to provide a meaningful picture of the extent and nature of various risks that the Bank is exposed to and the Banks’ risk management practices.
Governance and Oversight
The Bank’s Board of Directors has the overall responsibility for risk management and sets the tone at the top for the effective management of risks through its risk appetite. In discharging its governance responsibility, it operates through two key committees, namely the Integrated Risk Management Committee (IRMC) and the Board Audit Committee (BAC) which have been formed in compliance with the CBSL Direction No. 11 of 2007 on Corporate Governance.
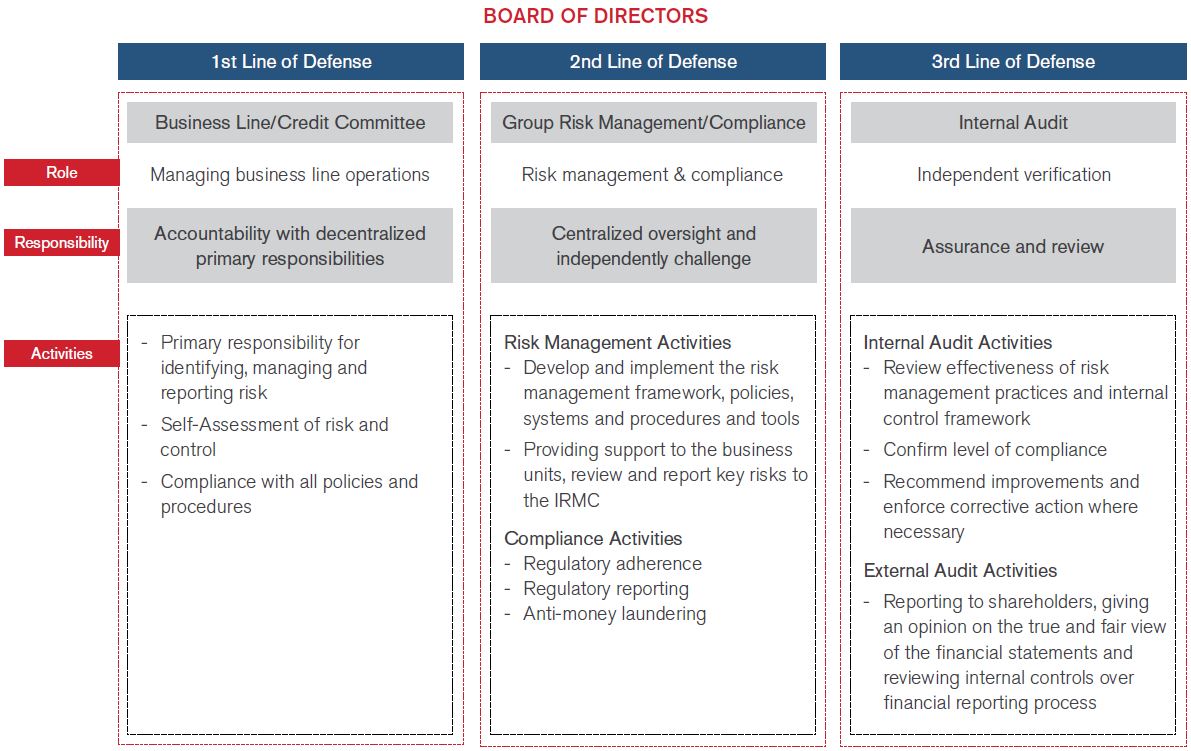
Governance Model
The governance model aims to place accountability and ownership, whilst facilitating an appropriate level of independence and segregation of duties. The structure is premised on the three lines of defense and defines the lines of authority, roles and responsibilities to efficiently manage risk across the Bank.
BOARD OF DIRECTORS
The ultimate governing body with overall risk oversight responsibility
BOARD SUB COMMITTEES
Integrated Risk Management Committee (IRMC)
Reviews the risk profile and policies of the Bank, its group companies and their application in the operations of the business in respect of the main risk categories viz. Credit Risk, Operational Risk, Liquidity Risk, Market Risk, Strategic Risk and Compliance, and ensures such risks are managed within the prudent levels decided by the Board of Directors.
Composition - Four Non-Executive Directors, CEO, CRO and Compliance Officer.


Board Audit Committee (BAC)
Assist the Board of Directors in its general oversight on financial reporting, internal controls and functions relating to internal and external audit.
Composition - Five members of the Board of Directors. The Vice President Group Audit functions as the Secretary to the Committee. The CEO, External Auditors and other members of the senior management attend meetings on invitation.
Board Credit Committee (BCC)
Reviews and approves Credit Proposals coming under the Committee’s delegated lending authority. Board of Directors.
Composition - Seven Non- Executive Directors and CEO.
BOARD SUB COMMITTEES
Credit and Market Risk Policy Committee (CMRPC)
Reviews the Bank’s risk policy framework, overall performance and the potential risks faced by specific lines of business and support functions.
Composition - CEO, CRO, Head of Credit Review, Heads of Business Units, Head of Treasury , Head of Credit Risk and Head of Market Risk.
Asset & Liability Management Committee (ALCO)
Reviews all Market and Liquidity related exposures on a monthly/more frequent basis and decisions are made to facilitate the business requirements and make pricing/ investment/policy decisions.
Composition - CEO, CRO, GCFO, Head of Treasury, Head of ALM and Heads of Business units.
Operational Risk Policy Committee (ORPC)
Monitors and ensures that an appropriate Operational Risk management framework is in place. Management of all aspects of operational risks and control lapses identified through the incident management process, internal audits and regulatory reviews whilst ensuring all significant issues raised are resolved within agreed timescales. Ensure full compliance of the local regulations. Raise awareness of new trends and developments in operational risk management techniques and migration to best practices. Assist the Bank in the management of Corporate Governance related to Operational Risk on an ongoing basis.
Composition - CEO, CRO, GCFO, Compliance Officer, Heads of Business Units, Heads of Support functions and Head of Operational Risk.
Group Risk Management
The Group Risk Management Division is independent of the business units and reports directly to the Integrated Risk Management Committee. Each unit within the Risk Management Division contributes to the management of risk and co-ordinates across the business functions to guarantee that risk management is impeccably integrated into the Bank’s corporate culture.
Further a Loan Review unit was formed within the Group Risk Management Division to carry out Loan Review Mechanism (LRM) activities as prescribed by the regulator. Its responsibilities extend to identifying potential problematic loans/facilities (post approval/granting) and providing rational, objective and professional recommendations for remedial action for implementation by line management.
In order to make the pre-approval process independent and with a view to further strengthen same the Credit Review Division which handles the pre credit review/approvals beyond specific thresholds also came under the purview of the Group Risk Management Division.
RISK CULTURE
A strong risk culture is the fundamental tenet of Bank’s risk management and serves as the foundation upon which a strong risk management structure is built. Within the Bank, the key characteristics of a strong risk culture are identified as follows:
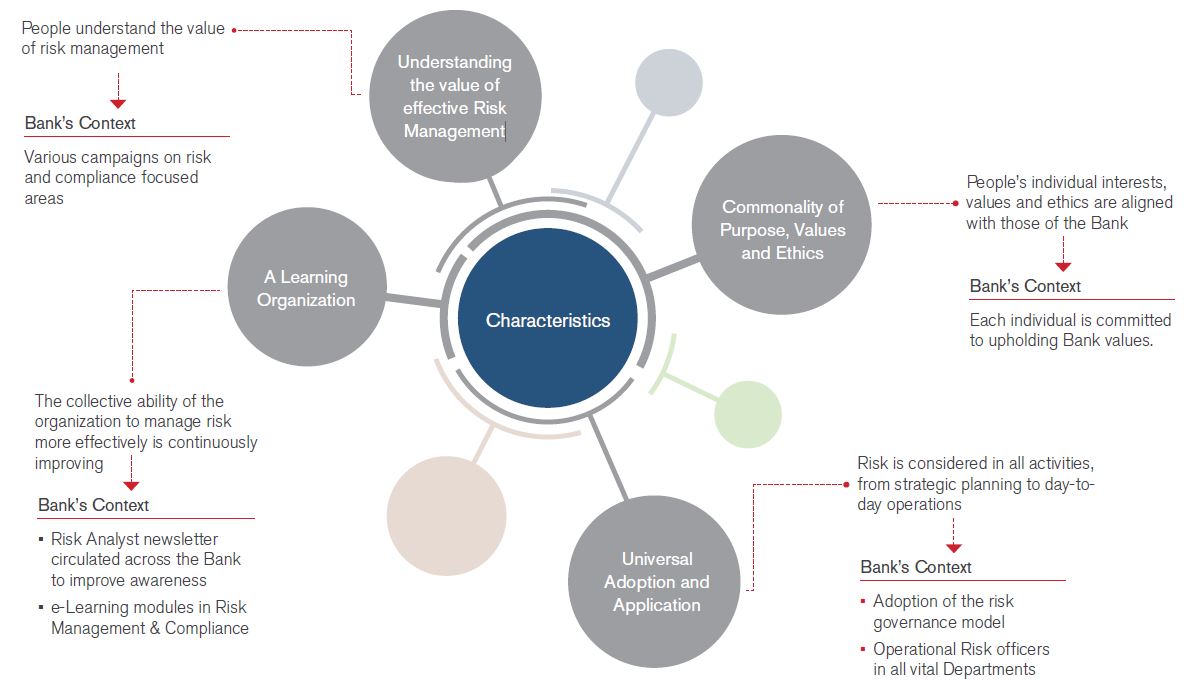
In the Bank a compliance culture is instilled where the Board, Senior Management and every employee is committed to adhere to the requirement of relevant laws, rules and regulatory guidelines. The Bank's commitment is clearly demonstrated through the establishment of strong policies and guidelines and ensuring that non-compliance risks are effectively managed. Such measures not only ensure adherence to regulations, but also protect the Bank’s integrity and reputation.
Risk Policies & Processes
CREDIT RISK
Credit risk is the risk of financial loss if a customer or counterparty fails to meet a payment obligation under a contract. It arises principally from direct lending, trade finance and leasing business, and also from offbalance sheet products such as letters of credit and guarantees. Credit Risk generates the largest regulatory capital requirement of the risks we incur. The Bank manages the Credit Risk in the entire portfolio as well as individual credits or transactions.
Objectives Of Credit Risk Management
The objectives of Credit Risk Management are:
-
Ensure optimal risk-reward pay-off for the Bank and to maximize returns
-
Maintain the quality of the portfolio by minimizing the non-performing loans and probable losses
-
Maintain a well-diversified portfolio by prudently managing the risk in the asset portfolio to ensure that the risk of excessive concentration to any industry, sector or individual customer is minimized
-
Ensure that exposures to any industry or customer are determined by the regulatory guidelines, clearly defined internal policies, debt service capability and balance sheet management guidelines
-
Avoid all situations of conflict of interest and report all insider-related credits to appropriate bodies
1
A Well-Defined Credit Policy approved by the Board of Directors
-
Set the Credit culture of the Bank
-
Specify target markets for lending
-
Specify prohibited lending
-
Set acceptable risk parameters
-
Set remedial and recovery actions
2
Structured and Standardized Credit Approval
-
Credit is extended only to suitable and well-identified customers
-
Never to take a credit risk where ability of the customer to meet obligations is based on the most optimistic forecast of events
-
Risk considerations shall have priority over business and profit considerations
-
The primary source of repayment for each credit is from an identifiable cash flow from the counterparty’s normal business operations or other financial arrangements
-
Adopt a pricing mechanism that reflects variation in the risk profile of various exposures to ensure that higher risks are compensated by higher returns
-
The financial performance of borrowers is to be continuously monitored and frequently reviewed
3
Delegation of Authority
-
Two Credit Committees representing the Business Lines
-
The delegated authority limits are reviewed periodically and the Bank follows the four-eyes principle
-
Lending decisions are based on detailed credit evaluation
4
Delegation of Authority
-
System driven obligor risk rating, facility risk rating and retail score cards to suit the diverse client portfolios of the Bank
-
Incorporating both quantitative and qualitative parameters
5
Risk Pricing
-
Pricing of credit risk using scientific methods
6
Post Sanction Review and Monitoring
-
Warning signals are identified
-
Watch listing process in place
-
Non-performing assets are identified at an early stage
7
Prudential Limits
Maximum exposure limits on;
-
Single Borrower/Group Exposure limits
-
Prudential Group Exposure limits
-
Substantial Exposure limits
-
Industry/Economic Sector limits
8
Portfolio Management
-
Evaluates exposures on the basis of industry concentration, rating quality, internally established pre specified early warning indicators
-
Regular portfolio reviews, stress tests and scenario analysis
-
The exposures in off balance sheet products are treated with utmost care
9
Portfolio Management
-
Ways out analysis
-
Comprehensive and legally enforceable documentation
-
Obtaining of collateral in line with the Bank's policy and ensuring enforceability
10
Impairment
-
Board approved policy
-
Clearly defined process
Credit Policies
The Bank has a well-defined credit policy approved by the Board of Directors. It defines the
-
Credit culture of the Bank
-
Specify target markets for lending
-
Specify prohibited lending which the Bank under no circumstances will entertain due to either the very high risks involved in such proposals and / or its negative social / ethical consideration
-
Set acceptable risk parameters
-
Set remedial and recovery actions
Structured and Standardized Credit Approval Process
Depending on the nature of the project / product standardized formats have been designed and evaluations are carried out by competent staff. There are clear guidelines set to ensure that;
-
Credit is extended only to suitable and well-identified customers and never where there is any doubt as to their ethical standards and record, where the source of repayment is unknown or speculative nor where the purpose/destination of funds is undisclosed;
-
Never to take a credit risk where ability of the customer to meet obligations is based on the most optimistic forecast of events;
-
Risk considerations shall have priority over business and profit considerations;
-
Ensure that the primary source of repayment for each credit is from an identifiable cash flow from the counterparty’s normal business operations or other financial arrangements; the realization of security remains a fallback option;
-
Adopt a pricing mechanism that reflects variation in the risk profile of various exposures to ensure that higher risks are compensated by higher returns;
-
The financial performance of borrowers is to be continuously monitored and frequently reviewed, as is the manner in which the borrower operates his accounts.
Delegation of Authorit
Final authority and responsibility for all activities that expose the Bank to credit risk rests with the Board of Directors and the Board of Directors has delegated approval authority to the CEO to re-delegate limits to the Credit Committees and the Business Lines. All approval limits are name specific and are based on the individual experience, facility type and collateral in order to ensure accountability and mitigate any judgmental errors.
-
There are two Credit Committees representing the Business Lines and these Committees comprise senior officers of Business Lines and the Credit Review Division.
-
The delegated authority limits are reviewed periodically and the Bank follows the ‘foureyes principle’ (i.e. minimum of two officers signing a credit proposal).
-
Lending decisions are based on detailed credit evaluation carried out by Relationship Managers/ Credit Officers and reviewed/ approved by designated approving authority.
Internal Risk Ratings of Obligors
The Bank has an Internal Risk Rating system which runs on sophisticated work flow based software and hosts obligor risk rating, facility risk rating and retail score cards to suit the diverse client portfolios of the Bank. This move facilitates accurate quantification of credit risk, and also complies with Central Bank Direction No. 07 of 2011 on Integrated Risk Management.
The Bank has deployed varying models to gauge the default risk associated with Large Corporate, Mid Corporate, SME and Non-Banking Financial Institutes. All of these models are structured in a manner incorporating both quantitative and qualitative parameters to reflect the underlying probabilities of default.
The risk rating model implemented facilitates both obligor and facility rating. Whilst obligor rating will indicate the expected probability of default (PD), the facility rating indicates the expected loss given default (LGD). Expected probability of default takes into account the characteristics of the obligor assessed via industry, business, management and financial risk silos, whilst facility rating takes into account the type of the facility, nature of the collateral and realizability. Using the expected probability of default and the loss given default calculated via obligor rating and facility rating models the system facilitates arriving at an expected loss for a specific credit.
Risk Scoring
The Bank deploys custom made scorecards to underwrite consumer assets. The scorecards take into account the customer demographics together with creditworthiness of individuals and disposable income in deciding the level of accommodation of credit. In addition to above, the Bank also carries out a prescreening of employers of salaried employees who seek consumer credit from the Bank in order to ensure that their level of income generation will not get interrupted in the foreseeable future. In this way the Bank acts more responsibly as such an approach would negate possibility of overspending by consumers based on uncertain future income.
Risk Pricing
The Bank also views pricing for risk as fundamental to Credit Risk Management. Thus steps have been taken to price the credit risk using more scientific methods. A risk based pricing model has been rolled out across the Bank .
Post Sanction Review and Monitoring Mechanism
Post sanction review and monitoring is carried out to ensure quality of credit is not compromised. Any deteriorating credits with emphasis on internal and external early warning signals are identified and such accounts are “Watch Listed”. The Watch Listed clients are monitored closely with quarterly reports submitted to the Credit Committees. Further, based on the Watch Lists the Bank assesses the Portfolio at Risk in the event, such accounts deteriorate further. Non-performing assets are identified at an early stage, enabling management to take action as appropriate.
Prudential Limits
The industry and portfolio limits are set by the Board of Directors on the recommendation of the Group Risk Management Department. Credit Risk Management monitors compliance with approved limits. Desired diversification is achieved by setting maximum exposure limits on
-
Single / group obligor exposures - limits are more stringent than the limits set by the regulator and on a prudential basis, the off- balance sheet items are considered at face value instead of credit equivalent of such exposures
-
Prudential Group exposures - considered based on the Bank’s exposure to a ‘Group of Related Parties' and is capped at 60% of the Bank’s Capital Base
-
Substantial exposures – this is in compliance with the Banking Act Direction No 07 of 2011 on Integrated Risk Management Framework for Licensed Banks and the Bank has introduced a substantial exposure limit of 500% of the capital base of the Bank
-
Industry/economic sector exposures - limits are imposed for lending to different sub- sectors in the economy. This is a control mechanism introduced recognizing that during various economic cycles, different sectors of the economy could face difficulties. At present the limit for a sub sector is set at 15%.
Portfolio Management
Credit portfolio management is an important function within the overall credit risk management function. Need for such critical and objective portfolio management emanates from the need to optimize the benefits associated with diversification. It also helps the Bank to identify and address potential adverse impact of concentration of exposures. The Bank has a well-structured portfolio management mechanism which evaluates exposures on the basis of industry concentration, rating quality, internally established pre specified early warning indicators apart from regulator imposed quantitative ceiling on the single borrower and aggregate exposure. The Bank’s internal single borrower and Group exposure limits are much stringent than those imposed by the regulator. Based on the feedback from the credit portfolio management, the credit origination criterion is amended prudently to insulate portfolios from further deterioration.
The portfolio management team also undertakes, apart from regular portfolio reviews, stress tests and scenario analysis when the external environment, both local and global, undergoes significant changes. Credit portfolio management envisages mitigating credit risks to a great extent by stipulating prudential risk limits on various risk parameters. As such, the Bank has established single borrower limit, limits for related party borrowings and aggregate limit for large exposures as prescribed by the regulators. Moreover the Bank has also established maximum limits to different industry segments. Such limits are clearly spelt out in the credit policy and the authority for permitting any deviations on an exceptional basis is also clearly documented. The Bank adopts a similar mechanism to assess the risks associated with off balance sheet exposures. As part of the credit portfolio management and monitoring procedures, the exposures in off balance sheet products such as FX Forwards, Guarantees and Letters of Credit are treated with utmost care.
KRIs supplement the overall portfolio management system, by providing a view of the credit risk of the portfolio as well as acting as an early warning system. Some of the KRIs monitored and reported to Board Integrated Risk Management Committee are given below;
|
Portfolio of the Bank Industry portfolio |
To assess the trends in comparison with industry and measure performance against budgets/Risk Appetite |
|
Market Share |
|
|
NPLs of the Bank Industry NPLs |
|
|
NPL Ratio of the Bank Industry Average NPL Ratio |
|
|
Impairment - Cumulative Charge - Individual Impairment % - Total Impairment against portfolio |
|
|
Provision Cover - % of the Bank Industry % |
|
|
Open Loan Position |
|
|
ROE % |
|
|
Tier I Capital Adequacy Ratio % |
To assess compliance with Regulatory limits and the Bank’s Risk Appetite |
|
Tier I + Tier II Capital Adequacy Ratio % |
Credit Risk Mitigation
The Bank adopts various mechanisms to mitigate the credit risk of the loan book.
-
Ways out analysis - the primary source is established through a conservative evaluation of whether the borrower's realistic projected cash flows will be sufficient to repay their debts. This is further mitigated by a second way out in the event of unforeseen adverse circumstances and availability of collateral alone does not make an unacceptable proposal viable. Exemptions on collateral are allowed in the event the borrower demonstrates strong and reliable financial performance.
-
Documentation of credit transactions with adequate terms, conditions and covenants in a comprehensive and legally enforceable basis.
-
Obtaining of collateral in line with the Bank's policy and ensuring it is supported by enforceable documentation. Collateral policy differs from business line to business line according to the products offered.
The main types of collateral taken by the Bank are
-
immovable property mortgages,
-
plant, machinery and equipment,
-
cash deposits,
-
mortgages on stocks and book debts and
-
corporate and personal guarantees.
-
It is the Bank's policy to be on a pari passu status with other lenders in terms of collateral cover. A decision to the contrary may be acceptable only where a non pari passu position is accepted due to unavailability of security as a result of the Bank being a late entrant to the relationship and is supported by strong financial position of the entity financed. Facilities under Product Programmes are governed by guidelines given in such individual programmes.
In instances where facilities are granted without collateral, the Bank ensures that its position will not be subordinated to other creditors’ interests. In such instances, the Bank generally requires either a negative pledge agreement not to encumber any assets without permission of the Bank or a pari passu clause, whereby the debtor will treat the Bank equally with respect to collateral with all current and future lenders.
The Bank has a panel of valuers who have been selected based on the criteria set out by the Central Bank of Sri Lanka. The Bank ensures that the valuations are carried out and reviewed as following.
-
Facilities in NPL:
-
In respect of credit facilities granted against residential property which is occupied by the borrower for residential purposes – every 4 years
-
In respect of credit facilities granted for all other purposes – every 3 years
-
-
Performing facilities:
-
Watch listed clients with working capital facilities - every 3 years
-
Other Clients with working capital facilities - every 5 years
-
No value is considered if valuations are not in line with the time frames set out as per the CBSL guidelines.
Impairment
The Bank has in place a detailed impairment policy which was approved by the Board of Directors. A credit risk provision for loan impairment is established if there is objective evidence that the Bank will be unable to collect all amounts due on loans and advances according to the original contractual terms.
Objective evidence that a loan is impaired includes observable data that comes to the attention of the Bank about the following loss events:
-
Significant financial difficulty of the customer
-
A breach of contract such as default of payment
-
A breach of contract such as default of payment
-
Where the Bank grants the customer a concession due to the customer experiencing financial difficulty
-
It becomes probable that the customer will enter bankruptcy or other financial reorganization
-
Observable data that suggests that there is a decrease in the estimated future cash flows from the loans, to name a few.
The Bank determines the allowances appropriate for each individually significant loan or advance on an individual basis if there is any objective evidence of a loss based on the above. Items considered when determining allowance amounts include
-
The sustainability of the counterparty’s business plan/cash flows,
-
Projected receipts and the expected payout should bankruptcy ensue,
-
The realizable value of collateral and the timing of the expected cash flows.
A provision for impairment of loans is reported as a reduction of the carrying amount of loans on the balance sheet. Additions to provisions for loan impairment are made through impairment losses on loans and receivables in the income statement.
All exposures are assessed for impairment either individually or collectively. If there is objective evidence of incurred loss individually i.e. for exposures which are considered to be individually significant (exposures above LKR 50 million), the exposure should be measured for an impairment provision. If it is determined that no objective evidence of incurred loss exists for an individually assessed exposure, that exposure should be included in a group of exposures with similar credit risk characteristics that are collectively assessed for impairment.
If there is objective evidence that an impairment loss on loans and receivables carried at amortized cost has been incurred, the amount of the loss is measured as the difference between the loans’ carrying amount and the present value of estimated future cash flows discounted at
-
the loan’s original effective interest rate, if the loan bears a fixed interest rate, or
-
current effective interest rate, if the loan bears a variable interest rate.
The estimation of the recoverable amount of a collateralized exposure reflects the cash flows that may result from Liquidation of Collateral where foreclosure is considered the likely course of action. The time, costs and difficulties involved in obtaining repayment through collateral should be taken into account when determining the recoverable amount.
For the purposes of a collective evaluation of impairment, loans are grouped on the basis of similar credit risk characteristics. Corporate and SME loans are grouped based on product type, economic sector and on days in arrears. Retail Banking loans are grouped based on product type and number of days in arrears. Those characteristics are relevant to the estimation of historical loss experience for loans. Historical loss experience is adjusted on the basis of Probability of Default and Loss Given Default. The Bank also bases its analyses on economic factors and portfolio factors such as :-
-
Macro Economic Factors such as
-
Interest rate stability
-
Unemployment rate
-
Inflation
-
GDP growth rate
-
Exchange Rate fluctuation
-
-
Portfolio Factors such as
-
Rescheduled Loans as a % of total Loans
-
Average Age of the portfolio
-
Management's judgment on delinquencies of the borrowers
-
-
Other Factors such as
-
Sovereign ratings assigned to Sri Lanka by local and international rating agencies
-
Global Economic Environment which has direct impact to the Sri Lankan economy
-
Borrower's ratings assigned by local and international rating agencies
-
The Bank may use the aforementioned factors as appropriate to adjust the impairment allowances. Allowances are evaluated separately at each reporting date with each portfolio.
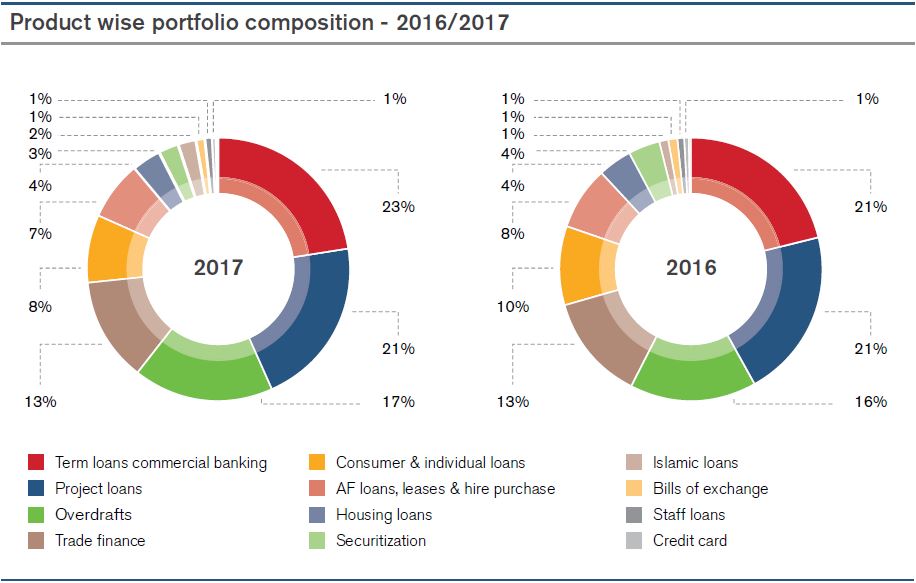
Credit Risk Analytics
Portfolio MixProduct Concentration
The Bank’s portfolio continues to be concentrated in working capital financing facilities and Project Loans.
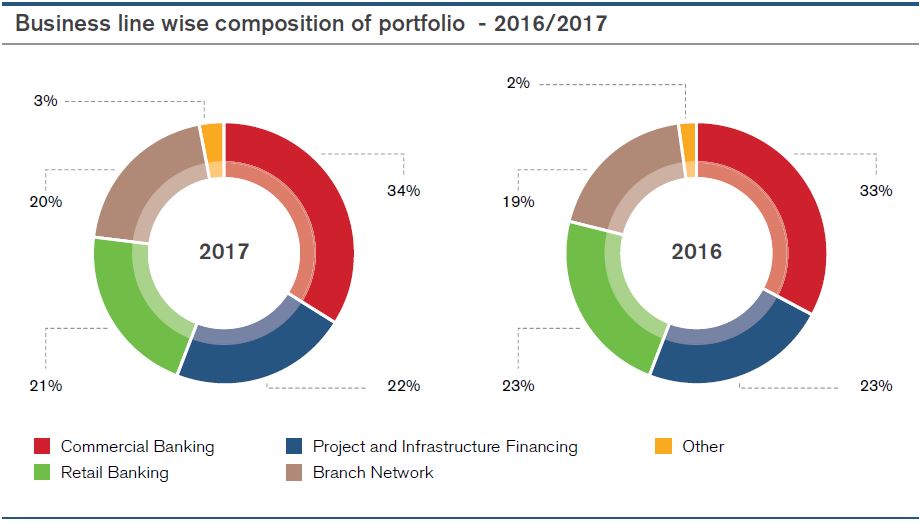
Business Line wise Composition
Business line wise composition of portfolio changed during the year in line with the long term strategy of the Bank.
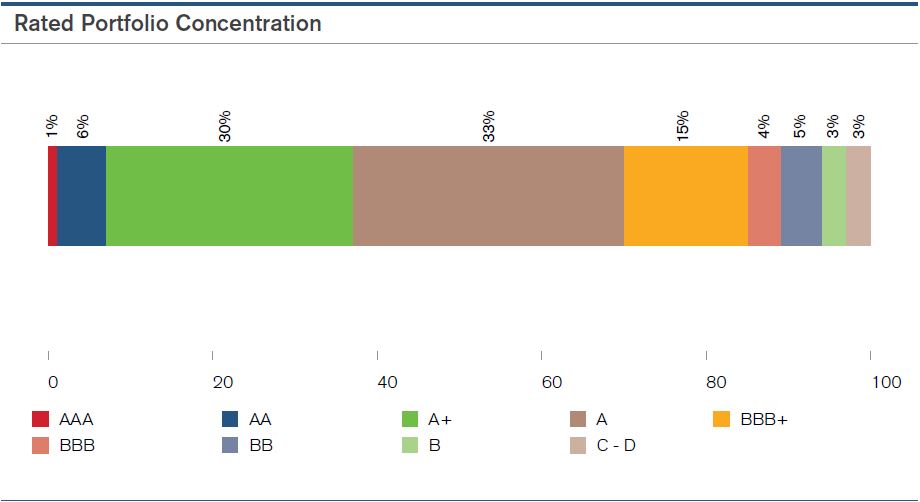
Rated Portfolio Concentration
The Bank’s rated portfolio continues to be concentrated on “A” rated clients based on the internal rating models used by the Bank to rate Corporate and SME clients and the composition was within the risk appetite of the Bank set by the Board.
Credit Risk Concentrations
Single Name Concentration
-
The Bank was in compliance with regulatory limits on Group and Single Borrower concentrations. The Bank was also in compliance with the internal limits set by the Board on Group and Single Borrower concentrations which are more stringent than those prescribed by the regulator.
-
The substantial exposures of the Bank accounted for only 132% of the capital base and was well within the internal limit.
-
The Bank’s portfolio concentrations were well within the risk appetite of the Bank set by the Board.
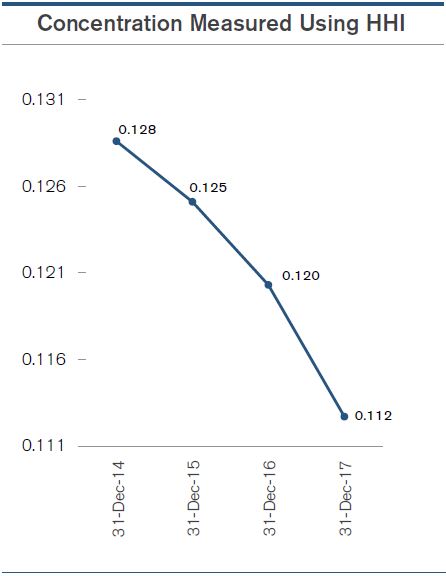
Sector Concentration
The Bank maintained a well-diversified portfolio and the portfolio was not over concentrated on a particular sector. The Bank was also in compliance with the minimum lending requirement of 10% to Agricultural sector. Bank measures the sector wise concentration risk using the Herfindhal-Hirschman Index and the trend indicated a reduction in concentration risk.
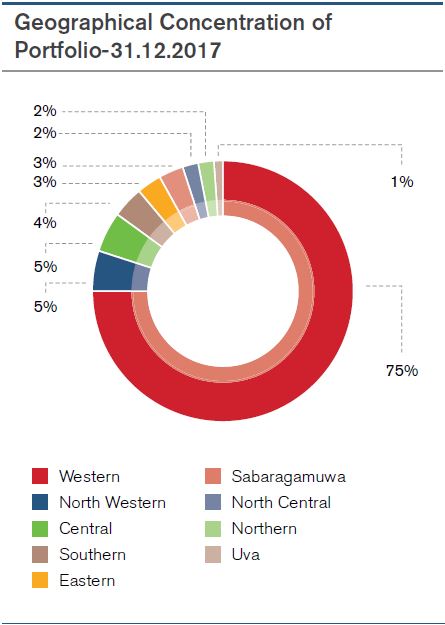
Geographical Concentration
Based on the economic activity highest concentration of domestic portfolio was in Western Province though the branch network is spread throughout the country. In line with Bank's strategy 96% of portfolio was concentrated locally.
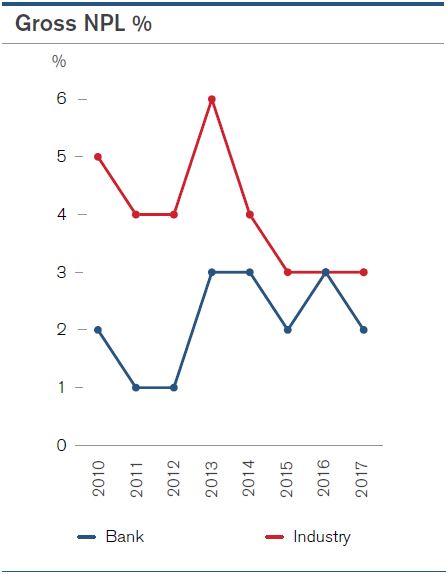
NPL Analysis
Non-Performing Loans
The Bank’s NPL ratio was well below the industry ratio reflecting a better quality portfolio than most players in industry.
NPL and Regulatory (CBSL) Provisioning on Balance Sheet Exposures as at 31 December 2017
|
(LKR '000) |
|
|
General Provision |
1,125,563.96 |
|
Non Performing - Specific Provisions |
2,470,896.62 |
|
Charges |
17,720.91 |
|
Total Specific Provision on NPLs |
2,488,617.53 |
|
Performing - Judgmental-Specific Provisions |
93,127.77 |
|
Total Loan Loss Provision |
3,707,309.26 |
|
|
NPL Amount LKR ‘000 |
Provisions as at 31 December 2017 |
Collateral Value considered for Provisioning purposes |
Net Exposure |
|
Pawning |
|
|
|
|
|
Special Mention |
602.70 |
- |
- |
602.70 |
|
Substandard |
131.60 |
26.32 |
- |
105.28 |
|
Doubtful |
17.00 |
8.50 |
- |
8.50 |
|
Loss |
989.96 |
989.96 |
- |
- |
|
Housing |
|
|
||
|
Special Mention |
69,597.93 |
- |
- |
69,597.93 |
|
Substandard |
24,733.60 |
4,946.72 |
- |
19,786.88 |
|
Doubtful |
3,645.01 |
1,822.50 |
- |
1,822.50 |
|
Loss |
73,985.90 |
43,188.64 |
30,797.26 |
30,797.26 |
|
Consumer Loans |
|
|
|
|
|
Special Mention |
77,073.23 |
- |
- |
77,073.23 |
|
Substandard |
24,157.88 |
4,831.58 |
- |
19,326.31 |
|
Doubtful |
35,040.61 |
17,520.31 |
- |
17,520.31 |
|
Loss |
203,355.81 |
203,355.81 |
- |
- |
|
Leases and Hire Purchase |
|
|
|
|
|
Special Mention |
368,048.67 |
- |
- |
368,048.67 |
|
Substandard |
82,964.49 |
16,592.90 |
- |
66,371.59 |
|
Doubtful |
16,197.76 |
8,098.88 |
- |
8,098.88 |
|
Loss |
96,224.43 |
96,224.43 |
- |
- |
|
Credit Card |
|
|
|
|
|
Special Mention |
5,970.36 |
- |
- |
5,970.36 |
|
Substandard |
33,261.71 |
8,315.43 |
- |
24,946.29 |
|
Doubtful |
25,816.66 |
12,908.33 |
- |
12,908.33 |
|
Loss |
97,860.18 |
97,860.18 |
- |
- |
|
Working Capital Facilities |
||||
|
Special Mention |
282,125.16 |
- |
- |
282,125.16 |
|
Substandard |
26,241.57 |
5,248.31 |
- |
20,993.25 |
|
Doubtful |
34,166.01 |
17,083.00 |
- |
17,083.00 |
|
Loss |
501,143.42 |
501,143.42 |
- |
- |
|
Term Loans |
|
|
|
|
|
Special Mention |
345,157.43 |
- |
148,156.22 |
345,157.43 |
|
Substandard |
262,946.48 |
16,195.52 |
54,459.67 |
246,750.95 |
|
Doubtful |
373,897.11 |
48,904.39 |
276,022.70 |
324,992.72 |
|
Loss |
880,931.33 |
799,754.97 |
57,539.22 |
81,176.37 |
|
Overdraft Facilities |
|
|
|
|
|
Special Mention |
241,360.13 |
- |
1,014.50 |
241,360.13 |
|
Substandard |
287,377.46 |
43,870.58 |
56,272.56 |
243,506.87 |
|
Doubtful |
144,060.49 |
62,827.70 |
18,940.65 |
81,232.79 |
|
Loss |
357,921.82 |
349,636.57 |
53,167.73 |
8,285.25 |
|
Other |
|
|
|
|
|
Special Mention |
1,097.23 |
- |
- |
1,097.23 |
|
Substandard |
- |
- |
- |
- |
|
Loss |
109,541.65 |
109,541.65 |
- |
- |
|
|
5,087,642.81 |
2,470,896.62 |
696,370.51 |
2,616,746.19 |
MARKET RISK
Market risk is the potential loss in both ‘On’ and ‘Off’-balance sheet positions arising from the movements in foreign exchange rates, interest rates, equity and commodity prices.
Objectives of Market Risk Management
The primary objective of Market Risk Management (MRM) is to ensure that Business units of the Bank optimize the risk-reward relationship within the Bank’s pre-defined risk appetite and avoid exposing the Bank to unacceptable losses.
Under a well-defined risk governance structure, the risks are identified, assessed, controlled and reported to ensure that the Bank operates within the allocated risk appetite levels. The Treasury activities are the key elements of Market Risk in the Bank, whilst other banking activities like deposit taking and lending activities forms a significant contribution over the same. The Treasury functions are segregated into three areas namely; Treasury Front Office, Market Risk Middle Office (MRMO) and Treasury Back Office where each unit has separate reporting lines to maintain independency. Treasury front office staff is guided by the Board approved Market and liquidity risk policies / limit framework and the Treasury Front Office Procedure guidelines. The procedure guideline provides the code of conduct for dealing room staff including the course of action to be taken in case of a violation of the rules and regulations stipulated therein.
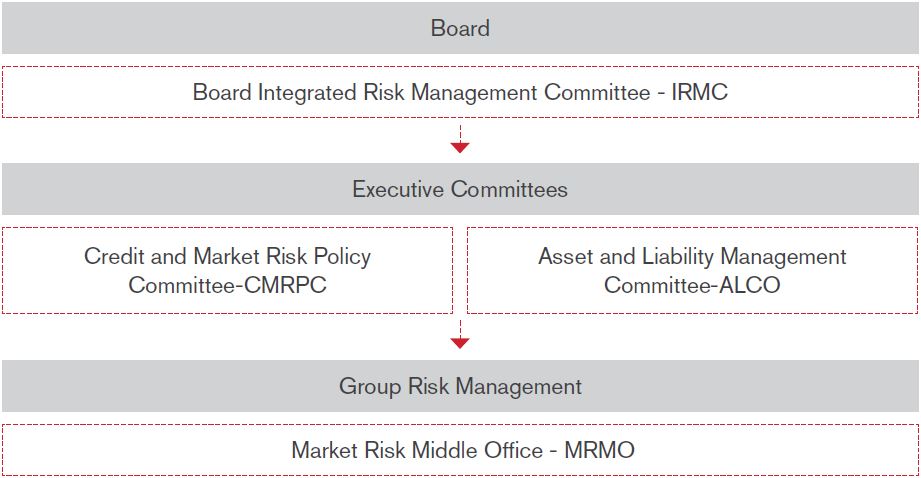
Market Risk Governance Structure
Policies
Risk monitoring is guided by a well-defined policy framework and limit structure designed to suit the business model and the balance sheet structure reflecting the risk appetite of the Bank. The Board supported by Integrated Risk Management Committee (IRMC) approves the risk parameters as recommended by the Asset and Liability Committee (ALCO) and Market Risk Middle Office (MRMO)to facilitate the business needs.
The risk management policy framework covers the Market, Liquidity, Asset and Liability risk management guidelines on the procedure and techniques for assessing, managing, monitoring and reporting of risks related therein. The policy framework consists of the roles and responsibilities, procedures, risk measurement framework, risk monitoring, reporting and controls taking into account the rules and regulations and the best industry practice.
Processes
The key functions of Market Risk Management include Policy formulation, Risk Measurement methodologies, systems, control, reporting and communication. This will provide guidance on procedure for Market risk Management within the overall risk appetite of the Bank.
Policy Formulation |
|
Policy formulation/ renewal are carried out considering the regulatory guidelines, best practice in the market and material changes in Market Risk Management/ Limit monitoring process |
Risk Measurement Methodologies |
|
Limits are assessed and recommended to ALCO / Board approval. All limits in force will be independently monitored by MRMO on pre-defined time bands |
Systems and Controls |
|
Support in implementation of management reporting systems to accurately reflect the risks taken by the Bank. Develop, implement, and review the controls that enforce the adherence to established risk limits. |
Risk Reporting and Communication |
|
MRMO risk activities are identified and monitored on a timely manner against the risk parameters and where necessary the exposures are reported for senior management/ Board for necessary action. |
The Market Risk reports are circulated at a number of frequencies - daily, weekly, monthly and quarterly basis to Treasury, Senior Management, ALCO, IRMC and Board for decision making.
ALCO as the key Management Committee that regularly monitors the Market Risk exposures initiates appropriate actions to optimize the Risk exposures within the Risk appetite of the Bank.
The implementation of the Bank’s Market Risk Management policies, procedures and systems are delegated to the Head of Market Risk Management/Middle Office who reports to the Chief Risk Officer. Market and liquidity risks are addressed at ALCO on a monthly basis and at the IRMC level on a monthly/ quarterly basis.
Analytics
MRMO uses a range of techniques to measure the risk exposures arising from Treasury/general banking activities. In accordance with the economic and regulatory requirements, we measure, monitor and control the Bank’s exposures to market risk, given the size, complexity and risk profile of the Bank.
Prudential internal limits have been defined for exchange rate risks, interest rate risk and Price risks for close monitoring of exposures including various techniques such as Mark to Market, sensitivity analysis, Value at Risk (VaR) calculations and Stress testing. The exposure limits are linked to the Bank’s capital base/ balance sheet size/profitability as appropriate to ensure adequate and efficient capital allocation and planning.
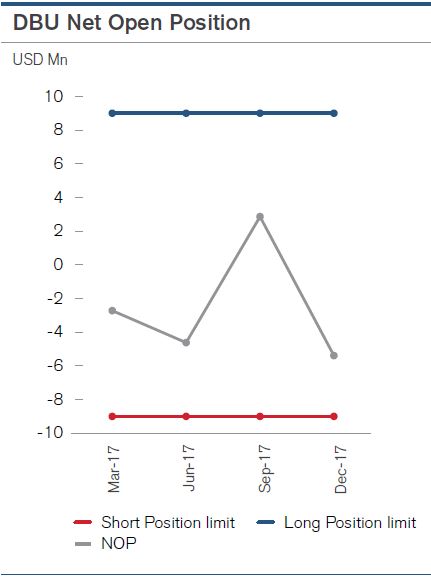
Foreign Exchange Risk
Foreign exchange risk is the risk of losses arising through holding of assets and liabilities in foreign currency and due to the movements in foreign exchange rates against the base currency. The Bank is exposed to foreign exchange risk when it's on and off balance sheet assets and liabilities are not equal in a given currency or when the timing and certainty of the inflows and outflows differ.
The Bank monitors the daily foreign exchange (FX) open positions to ensure that the Bank is operating within the regulatory limit on Net Open Position as depicted in the graph. Apart from the regulatory limit, the Bank has set internal prudential forex limits consisting of daily forex turnover limit, daylight position limit, forex gap limits, stress testing limits, sensitivity analysis, Swap funding limit and stop loss limits to closely monitor and mitigate foreign exchange risk.
The below table shows the Bank’s consolidated Foreign Exchange position and the exposure held against the Bank’s capital base which is managed well within the regulatory limit of 30%.
|
Foreign Exchange Position |
(DBU & FCBU) |
as at 31.12.2017 |
‘000 |
|||||
|
Currency |
Net AL Position |
Net Spot Position |
Net Forward Position |
Net Open Position |
Net Position in other Exchange Contracts |
Overall Exposure in Respective Foreign Currency |
Absolute Positions in USD Equivalent |
Overall Exposure in LKR |
|
US Dollars |
94,522.15 |
(2,348.64) |
(97,658.92) |
(5,485.42) |
0.00 |
(5,485.42) |
5,485.42 |
839,817.13 |
|
Pound Sterling |
(16,299.60) |
0.00 |
16,303.66 |
4.06 |
0.00 |
4.06 |
5.46 |
835.84 |
|
Euro |
(18,134.79) |
(12.27) |
18,100.45 |
(46.61) |
0.00 |
(46.61) |
55.68 |
8,524.43 |
|
Japanese Yen |
(31,144.03) |
0.00 |
28,306.24 |
(2,837.79) |
0.00 |
(2,837.79) |
25.17 |
3,852.77 |
|
Australian Dollar |
(18,613.30) |
0.00 |
18,620.92 |
7.63 |
0.00 |
7.63 |
5.94 |
910.09 |
|
Canadian Dollar |
(13.23) |
0.06 |
0.00 |
(13.18) |
0.00 |
(13.18) |
10.49 |
1,605.57 |
|
Other currencies |
(3,533.53) |
(475.00) |
4,818.67 |
810.14 |
0.00 |
810.14 |
248.48 |
38,042.35 |
|
Total Exposure |
893,588.19 |
|||||||
|
Total capital funds as per the latest audited financial statements |
28,737,835 |
|||||||
|
Total exposure as a % of total capital funds (should not exceed 30%) |
3.11% |
|||||||
Value at Risk (VaR)
VaR is a quantitative measure of the potential loss in value due to market movements which is expected for a defined period of time and a confidence level. The Bank’s Foreign exchange trading portfolio is subject to VaR measurement under historical simulation method on a daily basis. As prescribed by the Basel guidelines we calculate the VaR, using 99% confidence level for a one day holding period.
Value at Risk (VaR) on Forex Trading Portfolio
|
VaR - (at 99%) |
as at 31.12.2017 LKR million |
as at 31.12.2016 LKR million |
|
Forex Trading |
2.24 |
4.37 |
Historical approach, 1 day holding period
Stress Testing on DBU Net Open Position
Stress testing on Forex NOP under different magnitudes of shocks are performed to assess the impact on profitability as given below.
The Bank's Foreign Currency DBU Net Open Position and Stress Test Results as at 31.12.2017.
|
|
Net Position |
Scenario 1 |
Scenario 2 |
Scenario 3 |
Scenario 4 |
|
Magnitude of Shock (adverse) |
|
5% |
10% |
15% |
25% |
|
Spot Rate movement |
153.40 |
145.73 |
138.06 |
130.39 |
115.05 |
|
Net Open Position -DBU, Profit/loss (LKR) |
(5,396,107) |
41,388,143 |
82,776,285 |
124,164,428 |
206,940,713 |
Sensitivity Analysis
Daily sensitivity analysis is carried out on major foreign currency Net Open Positions (NOP) giving positive and negative shocks to the spot rates to determine the impact of exchange rate movements by way of profit or loss to the Bank’s income statement.
Exchange Rate Sensitivity of Major Foreign Currency Net Open Positions as at 31 December 2017.
|
Spot Rate Shocks |
LKR depreciate |
LKR appreciate |
||||||
|
Currency |
Net Open Position |
-5% |
-2.5% |
-1% |
Spot rate |
1% |
2.50% |
5% |
|
USD |
(5,485,416) |
(42,073,138) |
(21,036,569) |
(8,414,628) |
153.40 |
8,414,628 |
21,036,569 |
42,073,138 |
|
GBP |
4,056 |
42,069 |
21,035 |
8,414 |
207.42 |
(8,414) |
(21,035) |
(42,069) |
|
EUR |
(46,614) |
(429,654) |
(214,827) |
(85,931) |
184.34 |
85,931 |
214,827 |
429,654 |
|
JPY |
(2,837,788) |
(193,153) |
(96,577) |
(38,631) |
1.36 |
38,631 |
96,577 |
193,153 |
|
AUD |
7,626 |
45,808 |
22,904 |
9,162 |
120.14 |
(9,162) |
(22,904) |
(45,808) |
|
Total (LKR) |
|
(42,608,068) |
(21,304,034) |
(8,521,614) |
|
8,521,614 |
21,304,034 |
42,608,068 |
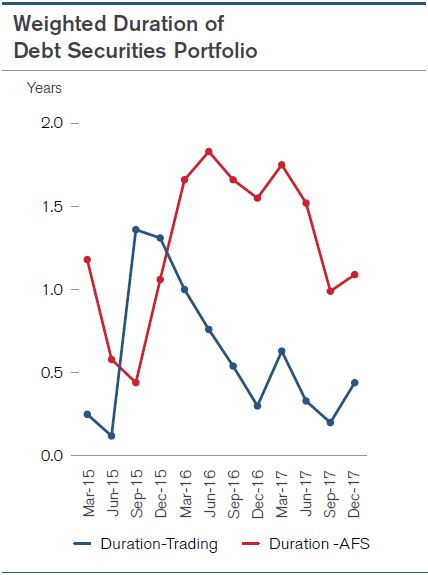
Interest Rate Risk (IRR) is the exposure of an institution's financial condition to adverse movements in interest rates. Changes in interest rates also affect the underlying value of the banking institution's assets, liabilities and off-balance sheet instruments, as the present value of future cash flows (and in some cases the cash flows themselves) change when interest rates change. Interest rate risk inherits various components; Re-pricing risk, basis risk, yield curve risk, option risk and price risk.
In order to manage the IRR, Bank has separated the balance sheet into trading and banking books. While the assets in the trading book (held for trading) are held primarily for generating profit through short term differences in prices/yields, the banking book (available for sale: AFS, held to maturity and loans and receivables) comprises assets and liabilities, which are contracted basically for steady income generation and are generally held till maturity. Thus, while the price risk is the prime concern of banks in the trading book, earnings or economic value changes are the main focus of the banking book.
The Bank’s trading portfolio mainly comprises securities (Treasury Bills/Bonds), and is monitored daily against the portfolio size limit, duration limit, maturity mismatch limit and mark to market limits. Portfolios are subject to VaR (Value at Risk) and PVBP analysis to analyze the impact on fluctuations in interest rates which are being closely monitored to take advantage of the market movements.
|
Key Indicators |
Limit |
Position as at 31.12.2017 |
|
Mark to Market of Debt Trading Portfolio |
LKR (60) million |
LKR 4.57 million |
|
Duration of Debt securities - HFT |
2 Years |
0.44 |
|
Duration of Debt securities - AFS |
5 Years |
1.09 |
Value at Risk (VaR) on Treasury Bills/Bonds Trading and Available for Sale (AFS) Portfolio
|
VaR - (at 99%) |
as at 31.12.2017 |
as at 31.12.2016 |
|
Debt Securities - HFT |
0.36 |
0.28 |
|
Debt Securities - AFS |
29.79 |
25.33 |
Historical approach, 1 day holding period
Interest Rate Risk in the Banking Book (IRRBB)The IRRBB arises mainly through non-trading asset and liabilities such as loans and advances, which is measured and managed through price sensitivity /duration/ NII and variance analysis, and the interest rate sensitivity gap analysis.
Interest Rate Sensitivity Gap AnalysisThe Bank monitors the interest rate sensitivity of assets and liabilities using re-pricing gap report (Disclosure note No. 56.2 (C)).
The price sensitivity (Economic value perspective) of the Balance Sheet is managed within the risk parameters whilst maximizing the market potential on interest sensitive assets and liabilities.
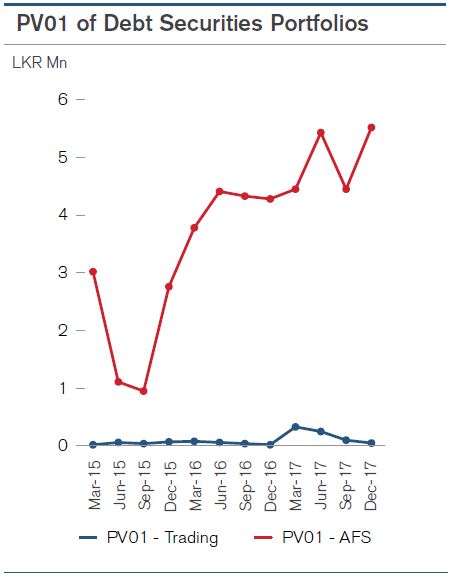
Duration Analysis
PV01 Analysis
Modified Duration & Price Sensitivity of Local Currency Assets and Liabilities
As at 31 December 2017
|
|
Duration |
Total Balance |
Price Sensitivity |
|
LKR million |
|
||
|
Assets: |
|||
|
Overdrafts - LKR |
2.65 |
42,563.23 |
1,126.32 |
|
Credit Cards |
2.65 |
1,611.35 |
42.64 |
|
Margin Trading |
2.65 |
31.05 |
0.82 |
|
Term Loans - LKR |
0.31 |
23,245.09 |
72.13 |
|
Project Loans Fixed |
1.44 |
27,439.68 |
394.33 |
|
Project Loans Adjustable |
0.07 |
30,795.01 |
20.64 |
|
Refinance loans |
0.87 |
15.48 |
0.14 |
|
Securitization Loans |
0.73 |
8,267.57 |
60.55 |
|
Post Import Finance - LKR |
0.12 |
13,536.81 |
16.65 |
|
Packing Credit - LKR |
0.10 |
35.10 |
0.04 |
|
Trade Bills - LKR |
0.13 |
55.79 |
0.07 |
|
DM Loans - Fixed |
1.69 |
18,074.89 |
305.18 |
|
DM Loans - Variable |
0.06 |
2,355.39 |
1.38 |
|
Vishmitha/Cash Back |
1.48 |
2,182.42 |
32.32 |
|
Housing Loans - Fixed |
2.78 |
6,460.92 |
179.57 |
|
Housing Loans - Variable |
0.07 |
3,588.09 |
2.47 |
|
Staff loans |
2.08 |
2,420.59 |
50.39 |
|
Pawning |
0.52 |
171.24 |
0.88 |
|
AF Lease |
1.25 |
15,043.09 |
188.31 |
|
AF Loans |
1.76 |
3,390.24 |
59.52 |
|
Hire Purchase |
0.61 |
291.32 |
1.77 |
|
IB Loans - LKR |
1.23 |
3,566.30 |
43.80 |
|
Deposits Placed - LKR |
0.00 |
75.00 |
0.00 |
|
Investments in T Bills HTM |
0.00 |
- |
- |
|
Investments in T Bonds HTM |
1.85 |
721.60 |
13.33 |
|
Investments in T Bills Trading |
0.09 |
746.14 |
0.70 |
|
Investments in T Bonds Trading |
0.94 |
454.58 |
4.26 |
|
Investments in Bills & Bonds AFS |
1.02 |
50,814.17 |
520.67 |
|
Investment in Debentures |
0.31 |
2,675.61 |
8.31 |
|
Reverse Repos |
0.00 |
- |
- |
|
Total Assets |
260,627.72 |
3,147.19 |
|
|
Liabilities: |
|
|
|
|
Demand Deposits - LKR |
1.51 |
17,370.81 |
261.79 |
|
Savings Deposits - LKR |
3.05 |
26,367.80 |
804.99 |
|
Call Deposits - LKR |
2.94 |
1,297.64 |
38.16 |
|
Term Deposits - LKR |
0.38 |
169,204.70 |
642.55 |
|
Margin Deposits - LKR |
3.09 |
585.00 |
18.09 |
|
Repurchase Agreements |
0.09 |
8,637.23 |
7.53 |
|
Money Market - LKR |
0.00 |
75.70 |
0.00 |
|
Institutional Borrowing - LKR |
0.00 |
- |
- |
|
Credit Lines - Fixed |
3.29 |
5,513.85 |
181.47 |
|
Credit Lines - Variable |
0.06 |
2,686.45 |
1.48 |
|
Debentures |
3.28 |
19,410.50 |
636.49 |
|
Equity & Other Liabilities |
2.65 |
9,478.04 |
251.17 |
|
Total Liabilities |
260,627.72 |
2,843.73 |
|
|
Price Sensitivity |
|
|
303.46 |
|
Limit |
1,000 |
Modified Duration - measurement of the portfolio to a 1% change in interest rates
Price Sensitivity - Sum of value change in each portfolio due to a 1% change in interest rates
Source - Fiserve ALM System
The Equity price risk arises due to adverse movement in the value of the individual stock price or of the corresponding equity index. Bank does not engage in equity trading at present but the investments held in the AFS portfolio are subject to mark to market valuation.
Equity Position Risk Measurements
|
|
Held for Trading LKR .000 |
Available for sale |
|
|
Impact on statement of Profit or Loss |
Impact on Other Comprehensive Income |
|
Shock of 15% on Equity price |
204,977 |
LKR 000'
|
TYPE |
Carrying Value |
Fair Value |
Realized gains/losses |
Unrealized gains/ losses |
Amount included in capital adequacy calculation |
|
|
Amount adjusted from CET 1 capital |
Amount considered for Market Risk |
|||||
|
Available for sale -AFS |
1,659,702 |
1,381,658 |
- |
(278,044) |
1,122,016 |
259,642 |
Commodity price risk arises due to volatilities in the commodity exposure of the Bank. The Bank was exposed to the Gold Buffer stock of the underlying product “Raththaran Ithurum” which was fully disposed during the year 2017.
Counterparty RiskWhen undertaking foreign exchange dealing and trading with interbank counterparties and corporates, two general types of risks arise.
-
Pre-settlement Risk - Refers to the counterpart becoming insolvent prior to the settlement date of transaction. The exposure comes by way of banks’ inability to find an alternate party to deal on same rates (interest or exchange) due to market changes.
-
Settlement Risk - Relates to the event where the counterpart to the deal is unable to honour settlement obligations (either in local currency or foreign currency) to the bank after having taken possession of funds paid by the bank in settlement.
The Bank set individual counterpart limits to mitigate such risk. These limits are set through critically assessing the financial standing, balance sheet size and other risk parameters of such counterparts.
LIQUIDITY RISK
Liquidity risk is the risk that the Bank is unable to meet its financial obligations in a timely manner without incurring unacceptable losses. Financial obligations include liabilities to depositors, payments due under derivative contracts, settlement of securities borrowings and repurchase transactions, lending and investment commitments.
Effective liquidity risk management is essential to maintain the confidence of depositors and counterparties as well as to ensure that the Bank’s core businesses continue to generate revenue, even under stressed conditions.
Objective of Liquidity Risk Management
The objective of our liquidity framework is to ensure that all anticipated funding commitments can be met when due and allow us to withstand liquidity stresses whilst maintaining our business profile. It is designed to be adaptable to changing business models, markets and regulations. The Bank continues to focus on liability generation, which will be a necessary pre-condition for significant asset growth.
Policy Framework
The Bank maintains well-articulated liquidity risk management policies and procedures, which drive the level of liquidity risk exposures and determine the business size and maturities which ensure that it has at all times sufficient liquidity to meet its financial obligations at a fair market price. Also the Bank monitors key liquidity metrics on a regular basis, both on local currency and foreign currency balance sheets and prudential limits are set to better manage the liquidity profile of the Bank.
Process
The responsibility for the Liquidity risk management of the Bank rests with the ALCO. Bank’s Treasury/ALM units are responsible for executing the day-to-day liquidity management of the Bank within the parameters set by ALCO. Key liquidity measures are managed and monitored on a daily, weekly or monthly basis to ensure that the Bank meets the regulatory (Liquid Asset Ratio, Statutory Reserve Requirement and Liquidity Coverage Ratio) as well as the internal limits whilst meeting the customer demands without incurring unacceptable losses.
In this context, MRMO circulates Reports on Open exposure levels, Liquidity risk exposures, ALM and liquidity risk assessment to the Management/Board on a regular basis.
Liquidity Risk Governance structure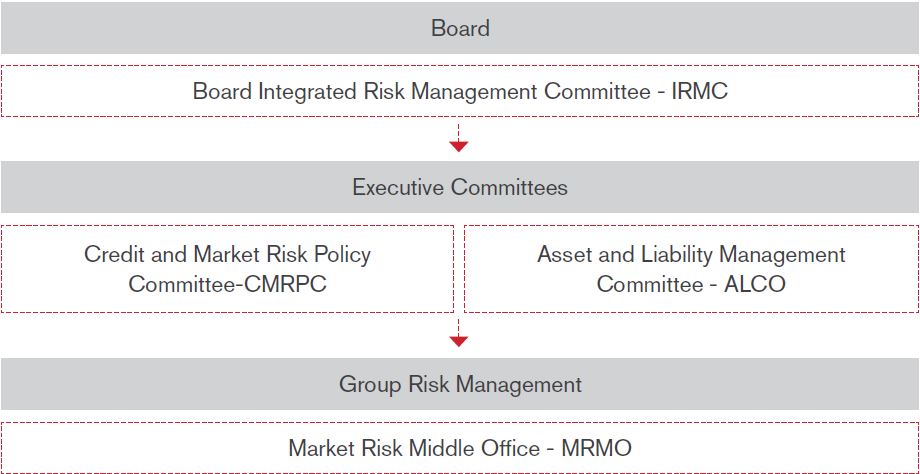
The Bank is equipped with a comprehensive Liquidity Contingency Funding Plan (LCFP) linked to the Business Continuity Plan, which is in line with the regulatory guidelines. The LCFP clearly defines the responsibilities of the Liquidity Management Team, Internal/external liquidity risk trigger points, stage for plan invocation/de-activation and the action plans to be exercised to ensure that all stakeholders of the Bank are safeguarded. We have also entered into reciprocal liquidity funding agreements with identified counterpart banks to ensure stability.
Liquidity Risk AnalyticsLiquidity measurement could be measured through Stock approach or Flow approach. Under the stock approach liquidity is measured in terms of key ratios which portray the liquidity stored in the balance sheet. In the flow approach a statement of maturities of assets and liabilities is prepared placing all cash flows in time bands according to the residual time to maturity. Separate gap limits are set for the local currency and foreign currency maturity mismatch reports based on the size and the nature of the Bank’s balance sheet.
Bank uses several internal prudential measures to manage its liquidity position, whilst meeting the regulatory limit. Certain limits are set for key liquidity measures, above the regulatory limit to give early warnings signals of tightening liquidity positions of the Bank. Factors such as market liquidity, exposure to interbank market, movement on loans and advances, deposit mix will be regularly monitored to identify any impending liquidity strain on the Bank.
Key Risk MetricsSelected KRIs are highlighted below which provide a view of the Liquidity Risk indicators where regulatory/internal limits are set and monitored at pre-defined intervals, which provide early warning signals on liquidity position of the Bank. The bank has set more stringent internal limits for statutory Liquid Asset Ratio and Liquidity Coverage Ratio as an early warning signal to monitor impending liquidity stress situations.
|
Key Indicators |
Limit |
Position |
|
Statutory Liquid Asset Ratio % - DBU |
20 |
22.13 |
|
Statutory Liquid Asset Ratio % - FCBU |
20 |
24.01 |
|
Liquidity Coverage Ratio (LCR) % - LKR Currency |
80 |
214.35 |
|
Liquidity Coverage Ratio (LCR) % - All Currency |
80 |
154.50 |
|
Advances to Deposit Ratio % |
106 |
102.0 |
|
Medium Term Funding Ratio % |
60 |
68.3 |
|
Concentration Ratio % of Top 20 Depositors |
25 |
19.95 |
|
Commitment Limit - LKR billion |
125 |
114.36 |
The Bank’s funding diversification depicts the optimum level of sources of funds by primarily depending on customer deposits whilst maintaining the sensitivity towards the top depositors.
Ratios Under Stock ApproachThe key ratios under the stock approach which are regulatory requirements include the Statutory Liquid Asset Ratio and Liquidity Coverage Ratio.
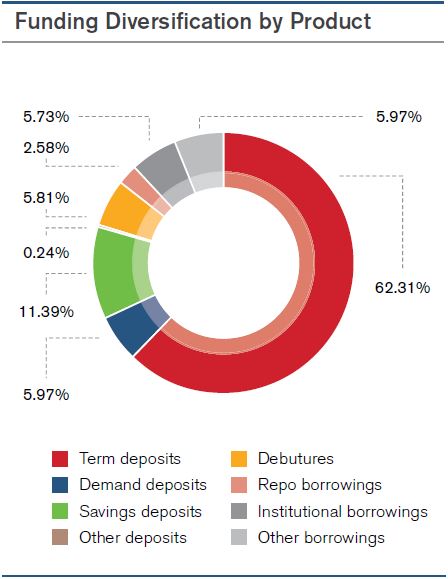
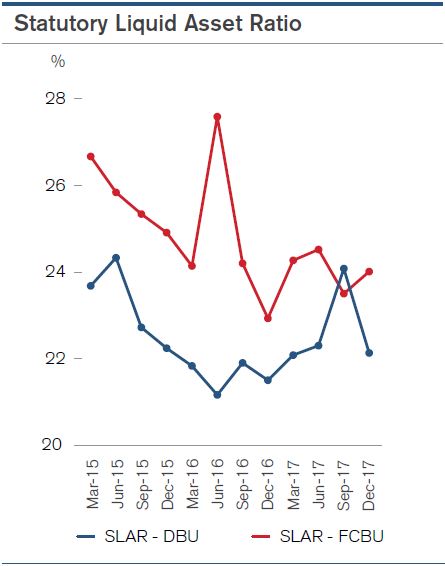
The LCR intends to promote short-term resilience of banks in ensuring that it has an adequate stock of high-quality liquid assets that can be converted easily into cash to meet their liquidity needs for a period of 30 calendar days under a liquidity stress scenario; thus reducing the risk of spill-over from the financial sector to the real economy.
The position of Net Loans to Total Assets Ratio, Advances to Deposit Ratio, Liquid Assets to short term liabilities and Commitments to Liquid Assets Ratio which are used to measure the liquidity position in the Bank is depicted below.
Flow ApproachA statement of Maturities of Assets and Liabilities (MAL) is prepared by the Bank placing all cash inflows and outflow in the time bands according to the residual time to maturity and non-maturity items as per CBSL recommended and Bank specific behavioural assumptions.
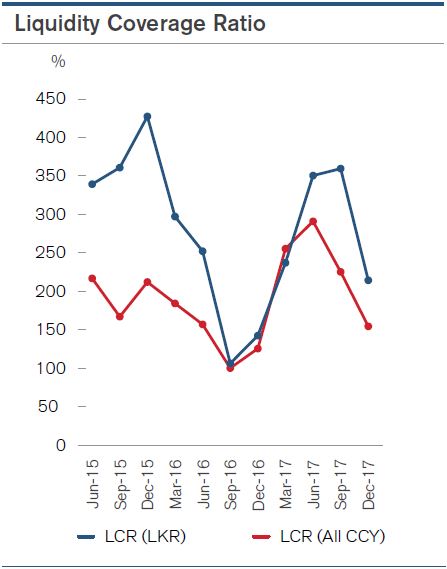
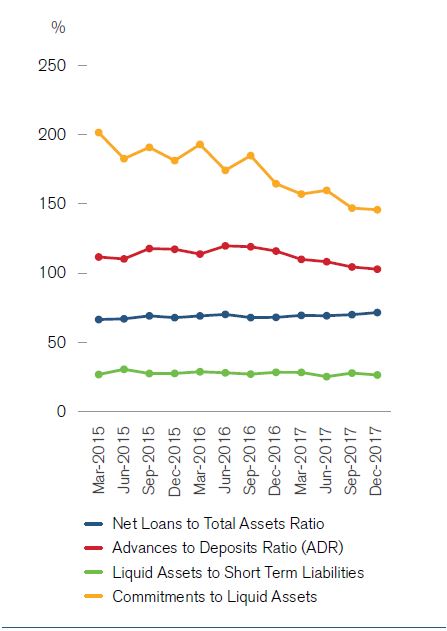
Maturity Gap Analysis for Local Currency Denominated Assets and Liabilities - as at 31.12.2017
LKR '000
|
|
Up to 1 Month |
1-3 Months |
3-6 Months |
6-12 Months |
1-3 Years |
3-5 Years |
Over 5 Years |
Total |
|
Assets: |
||||||||
|
Overdrafts - LKR |
3,229,590 |
3,229,590 |
3,229,590 |
6,459,180 |
8,971,084 |
8,971,084 |
8,473,110 |
42,563,228 |
|
Credit Cards |
120,460 |
120,460 |
120,460 |
240,920 |
334,612 |
334,612 |
339,825 |
1,611,349 |
|
Margin Trading |
2,328 |
2,328 |
2,328 |
4,657 |
6,468 |
6,468 |
6,468 |
31,046 |
|
Term Loans - LKR |
11,934,947 |
6,744,719 |
2,609,302 |
1,082,762 |
1,143,871 |
821,880 |
(1,092,394) |
23,245,088 |
|
Project Loans Fixed |
779,277 |
1,253,697 |
2,202,679 |
3,332,140 |
11,438,961 |
5,402,730 |
3,030,199 |
27,439,683 |
|
Project Loans Adjustable |
282,136 |
479,810 |
1,194,059 |
2,370,007 |
8,669,558 |
6,080,878 |
11,718,562 |
30,795,010 |
|
Refinance loans |
- |
389 |
- |
4,730 |
9,369 |
- |
990 |
15,478 |
|
Securitization Loans |
182,635 |
541,820 |
1,216,400 |
2,486,070 |
2,428,480 |
- |
1,412,163 |
8,267,568 |
|
Post Import Finance - LKR |
5,265,882 |
5,868,854 |
2,344,757 |
102,002 |
- |
- |
(44,689) |
13,536,806 |
|
Packing Credit - LKR |
81,250 |
87,700 |
41,000 |
- |
- |
- |
(174,855) |
35,095 |
|
Trade Bills - LKR |
25,866 |
- |
12,285 |
- |
- |
- |
17,641 |
55,792 |
|
DM Loans - Fixed |
428,425 |
709,014 |
1,065,362 |
2,148,388 |
8,118,890 |
4,925,140 |
679,667 |
18,074,886 |
|
DM Loans - Variable |
80,017 |
73,982 |
107,872 |
185,590 |
692,461 |
744,089 |
471,377 |
2,355,388 |
|
Vishmitha/Cash Back |
87,658 |
157,936 |
219,762 |
317,875 |
788,111 |
452,216 |
158,865 |
2,182,425 |
|
Housing Loans - Fixed |
60,393 |
121,338 |
166,187 |
334,570 |
1,380,523 |
1,156,657 |
3,241,253 |
6,460,922 |
|
Housing Loans - Variable |
25,203 |
50,470 |
77,397 |
162,930 |
588,856 |
617,033 |
2,066,198 |
3,588,087 |
|
Staff loans |
48,419 |
96,838 |
145,257 |
290,513 |
1,162,053 |
677,864 |
(358) |
2,420,585 |
|
Pawning |
9,605 |
14,147 |
33,114 |
103,413 |
- |
- |
10,959 |
171,238 |
|
AF Lease |
489,494 |
774,159 |
1,165,107 |
2,277,696 |
7,383,377 |
2,767,395 |
185,867 |
15,043,094 |
|
AF Loans |
91,076 |
181,616 |
268,945 |
518,598 |
1,620,829 |
626,766 |
82,409 |
3,390,239 |
|
Hire Purchase |
19,506 |
36,863 |
51,215 |
84,851 |
97,191 |
31 |
1,659 |
291,317 |
|
IB Loans - LKR |
1,573,002 |
830,452 |
214,894 |
11,378 |
215,720 |
599,216 |
121,640 |
3,566,302 |
|
Non Performing Loans & Advances |
- |
- |
- |
327,327 |
- |
- |
981,980 |
1,309,307 |
|
Cash |
3,035,905 |
- |
- |
- |
- |
- |
- |
3,035,905 |
|
Deposits Placed - LKR |
75,000 |
- |
- |
- |
- |
- |
- |
75,000 |
|
Nostro - Central Bank |
769,143 |
769,143 |
769,143 |
1,538,286 |
3,845,715 |
3,845,715 |
3,827,777 |
15,364,921 |
|
Investments in T Bills HTM |
- |
- |
- |
- |
- |
- |
- |
- |
|
Investments in T Bonds HTM |
- |
- |
- |
- |
624,821 |
96,776 |
- |
721,597 |
|
Investments in T Bills Trading |
498,500 |
243,782 |
- |
- |
- |
- |
3,861 |
746,143 |
|
Investments in T Bonds Trading |
- |
9,704 |
98,934 |
- |
345,941 |
- |
- |
454,578 |
|
Investments in T Bills AFS |
4,970,513 |
978,902 |
7,960,699 |
21,593,513 |
- |
- |
274,964 |
35,778,591 |
|
Investments in T Bonds AFS |
- |
199,661 |
1,087,414 |
1,335,641 |
2,329,920 |
8,602,308 |
1,480,633 |
15,035,576 |
|
Investment in Shares |
- |
- |
- |
- |
- |
- |
1,400,184 |
1,400,184 |
|
Investment in Debentures |
- |
- |
348,100 |
613,090 |
1,714,420 |
- |
- |
2,675,610 |
|
Reverse Repos |
- |
- |
- |
- |
- |
- |
- |
- |
|
Other Assets |
- |
- |
- |
- |
- |
- |
9,162,827 |
9,162,827 |
|
Total Assets |
34,166,231 |
23,577,374 |
26,752,263 |
47,926,130 |
63,911,230 |
46,728,857 |
47,838,781 |
290,900,865 |
|
Demand Deposits - LKR |
3,305,799 |
3,305,799 |
2,479,349 |
3,305,799 |
- |
- |
4,974,066 |
17,370,811 |
|
Savings Deposits - LKR |
1,322,229 |
1,322,229 |
1,322,229 |
2,644,457 |
6,611,143 |
6,611,143 |
6,534,375 |
26,367,804 |
|
Call Deposits - LKR |
64,985 |
64,985 |
64,985 |
129,971 |
324,927 |
324,927 |
322,857 |
1,297,638 |
|
Margin Deposits - LKR |
28,716 |
28,716 |
28,716 |
57,433 |
143,582 |
143,582 |
154,256 |
585,001 |
|
Term Deposits - LKR |
36,128,904 |
48,819,265 |
36,595,293 |
38,464,599 |
5,476,784 |
3,719,848 |
3 |
169,204,697 |
|
Repurchase Agreements |
6,197,690 |
1,573,365 |
622,641 |
243,529 |
|
- |
- |
8,637,226 |
|
Money Market - LKR |
75,700 |
- |
- |
- |
- |
- |
- |
75,700 |
|
Institutional Borrowing - LKR |
- |
- |
- |
- |
- |
- |
- |
- |
|
Credit Lines - Fixed |
- |
40,708 |
100,754 |
260,133 |
1,607,229 |
405,447 |
3,099,580 |
5,513,852 |
|
Credit Lines - Variable |
- |
90,367 |
54,801 |
262,058 |
570,930 |
331,670 |
1,376,624 |
2,686,451 |
|
Debentures |
- |
- |
- |
2,771,590 |
10,000,000 |
- |
6,638,913 |
19,410,503 |
|
Other Liabilities |
- |
- |
- |
- |
- |
- |
14,895,268 |
14,895,268 |
|
Equity |
- |
- |
- |
- |
- |
- |
24,855,740 |
24,855,740 |
|
Total Liabilities |
47,124,023 |
55,245,435 |
41,268,770 |
48,139,569 |
24,734,596 |
11,536,618 |
62,851,680 |
290,900,691 |
|
|
|
|||||||
|
Period Gap |
(12,957,793) |
(31,668,061) |
(14,516,507) |
(213,439) |
39,176,635 |
35,192,238 |
(15,012,899) |
174 |
|
Cumulative Gap |
(12,957,793) |
(44,625,853) |
(59,142,360) |
(59,355,800) |
(20,179,165) |
15,013,074 |
174 |
|
|
Cumulative Liabilities |
47,124,023 |
102,369,458 |
143,638,228 |
191,777,797 |
216,512,392 |
228,049,010 |
290,900,691 |
|
|
Cumulative Gap as a % of cumulative liabilities |
(27.50%) |
(43.59%) |
(41.17%) |
(30.95%) |
(9.32%) |
6.58% |
0.00% |
|
Liquidity Gap Analysis of Foreign Currency Denominated Assets and Liabilities
The Gap Analysis of Foreign Currency denominated assets and liabilities provides the cash flow obligations which assist in managing the foreign exchange liquidity in a prudential manner.
Maturity Gap Analysis for Foreign Currency Denominated Assets and Liabilities - as at 31.12.2017
|
|
Up to 1 Month |
1-3 Months |
3-6 Months |
6-12 Months |
1-3 Years |
3-5 Years |
Over 5Years |
Total |
|
Assets: |
|
|||||||
|
Overdrafts - USD |
1,496 |
1,496 |
1,496 |
2,992 |
4,155 |
4,155 |
4,155 |
19,945 |
|
Overdrafts - EUR |
8 |
8 |
8 |
15 |
21 |
21 |
21 |
101 |
|
Overdrafts - GBP |
- |
- |
- |
- |
- |
- |
- |
- |
|
Overdrafts - Other |
- |
- |
- |
- |
- |
- |
- |
- |
|
Short Term Loans - USD |
69,263 |
16,816 |
18,945 |
6,459 |
30,412 |
53,550 |
50,923 |
246,367 |
|
Short Term Loans - EUR |
324 |
149 |
7 |
1,130 |
389 |
- |
- |
1,999 |
|
Post Import Finance - USD |
5,781 |
7,051 |
1,082 |
- |
- |
- |
15 |
13,930 |
|
Post Import Finance - EUR |
- |
19 |
- |
- |
- |
- |
- |
19 |
|
Post Import Finance - Other |
- |
- |
- |
- |
- |
- |
- |
- |
|
Packing Credit - USD |
44,322 |
60,229 |
19,361 |
9 |
- |
- |
1,174 |
125,094 |
|
Packing Credit - EUR |
813 |
242 |
- |
- |
- |
- |
- |
1,056 |
|
Trade Bills - USD |
7,705 |
8,927 |
1,247 |
- |
- |
- |
(69) |
17,811 |
|
Trade Bills - EUR |
64 |
41 |
42 |
- |
- |
- |
- |
147 |
|
IB Loans - USD |
5,865 |
9,622 |
- |
- |
- |
- |
(69) |
15,419 |
|
Non Performing Loans & Advances |
- |
- |
- |
116 |
- |
- |
348 |
464 |
|
Nostro - USD |
14,622 |
- |
- |
- |
- |
- |
- |
14,622 |
|
Deposits Placed - USD |
5,000 |
- |
- |
- |
- |
- |
- |
5,000 |
|
SLDBs |
19,000 |
40,000 |
14,000 |
23,000 |
15,000 |
25,000 |
- |
136,000 |
|
Other Assets |
- |
- |
- |
- |
- |
- |
- |
- |
|
Total Assets |
174,262 |
144,601 |
56,189 |
33,720 |
49,976 |
82,726 |
56,498 |
597,972 |
|
|
|
|||||||
|
Liabilities: |
|
|||||||
|
Demand Deposits - USD |
2,959 |
2,959 |
2,219 |
2,959 |
- |
- |
4,202 |
15,298 |
|
Demand Deposits - EUR |
214 |
214 |
160 |
214 |
- |
- |
268 |
1,069 |
|
Demand Deposits - GBP |
2 |
2 |
1 |
2 |
- |
- |
2 |
9 |
|
Demand Deposits - Other |
105 |
105 |
78 |
105 |
- |
- |
131 |
523 |
|
Savings Deposits - USD |
3,148 |
3,148 |
3,148 |
6,296 |
15,739 |
15,739 |
16,839 |
64,057 |
|
Savings Deposits - EUR |
209 |
209 |
209 |
418 |
1,046 |
1,046 |
1,052 |
4,190 |
|
Savings Deposits - GBP |
233 |
233 |
233 |
466 |
1,164 |
1,164 |
1,167 |
4,659 |
|
Savings Deposits - Other |
189 |
189 |
189 |
378 |
946 |
946 |
946 |
3,784 |
|
Call Deposits - USD |
625 |
625 |
625 |
1,250 |
3,124 |
3,124 |
3,154 |
12,526 |
|
Call Deposits - EUR |
116 |
116 |
116 |
232 |
579 |
579 |
830 |
2,566 |
|
Call Deposits - GBP |
38 |
38 |
38 |
75 |
189 |
189 |
189 |
754 |
|
Call Deposits - Other |
97 |
97 |
97 |
193 |
483 |
483 |
483 |
1,933 |
|
Margin Deposits - USD |
50 |
50 |
50 |
99 |
248 |
248 |
673 |
1,418 |
|
Term Deposits - USD |
68,090 |
22,218 |
43,669 |
47,756 |
271 |
537 |
- |
182,539 |
|
Term Deposits - EUR |
2,298 |
2,073 |
6,806 |
6,361 |
18 |
- |
- |
17,556 |
|
Term Deposits - GBP |
3,748 |
5,374 |
2,530 |
4,767 |
- |
- |
- |
16,420 |
|
Term Deposits - Other |
1,695 |
2,890 |
4,208 |
4,287 |
2 |
3 |
- |
13,085 |
|
Money Market - USD |
20,000 |
5,400 |
25,000 |
7,000 |
- |
- |
(12) |
57,388 |
|
Money Market - EUR |
- |
- |
- |
- |
- |
- |
- |
- |
|
Money Market - GBP |
101 |
- |
- |
4 |
- |
- |
- |
105 |
|
Institutional Borrowings - USD |
52,500 |
10,000 |
10,000 |
- |
- |
- |
- |
72,500 |
|
IFC Borrowing |
- |
1,500 |
- |
1,500 |
6,000 |
6,000 |
(148) |
14,852 |
|
Proparco Borrowing |
- |
- |
5,769 |
5,769 |
23,077 |
23,077 |
(833) |
56,859 |
|
Other Liabilities |
- |
- |
- |
- |
- |
- |
28,504 |
28,504 |
|
Equity |
- |
- |
- |
- |
- |
- |
25,377 |
25,377 |
|
Total Liabilities |
156,414 |
57,438 |
105,145 |
90,130 |
52,887 |
53,135 |
82,823 |
597,972 |
|
|
|
|||||||
|
Period Gap |
17,848 |
87,163 |
(48,957) |
(56,409) |
(2,911) |
29,591 |
(26,324) |
0 |
|
Cumulative Gap |
17,848 |
105,011 |
56,054 |
(356) |
(3,266) |
26,324 |
0 |
|
|
Cumulative Liabilities |
156,414 |
213,852 |
318,997 |
409,127 |
462,014 |
515,149 |
597,972 |
|
|
Cumulative Gap as a % of Cumulative Liabilities |
11.41% |
49.10% |
17.57% |
-0.09% |
-0.71% |
5.11% |
0.00% |
|
OPERATIONAL RISK
Objectives of Operational Risk ManagementOperational risk arises due to inadequate or lack of controls over critical activities, failure of systems and procedures or due to external factors. It is no longer appropriate to permit the management of operational risks only to the individual departments as it is likely to occur in all activities of business and may lead to both financial and non-financial losses. There must be a systematic approach in institutions to successfully embed operational risk management within a robust governance framework in order to reap benefits ranging from easier compliance and reporting to stronger financial performance.
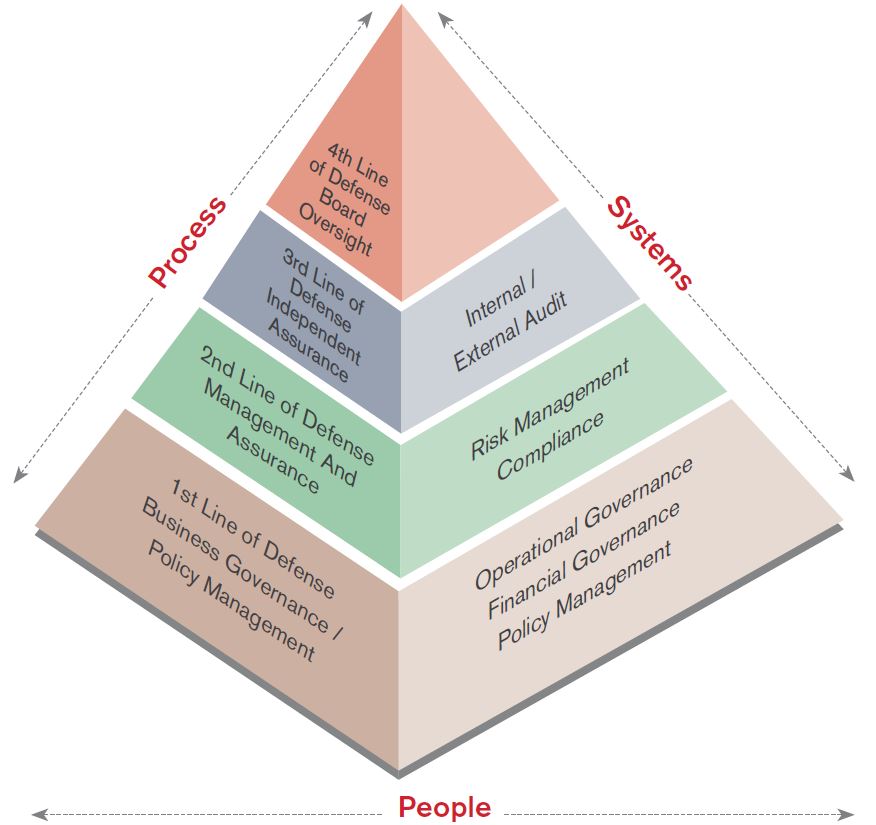
Operational Risk is managed through a consistent framework Group-wide as defined in the operational risk policies, enabling to determine the operational risk profile for the Bank and the Group.
The objectives of development and implementation of Operational Risk policies include:
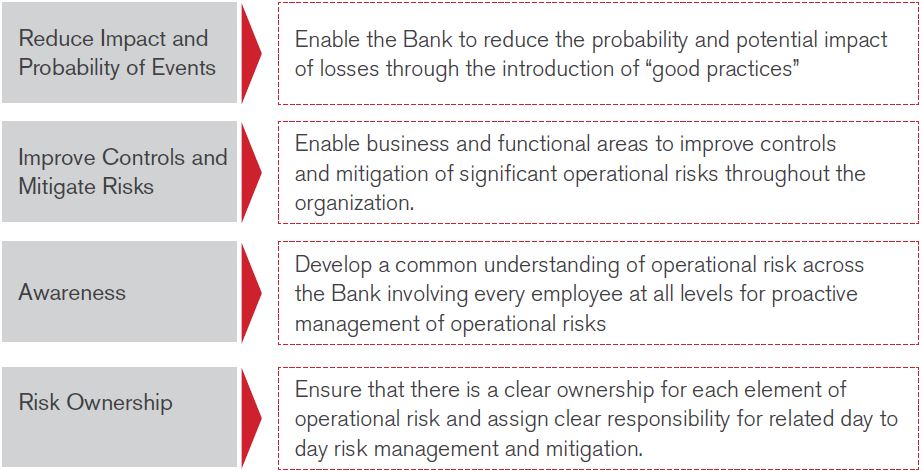
Operational Risk Framework
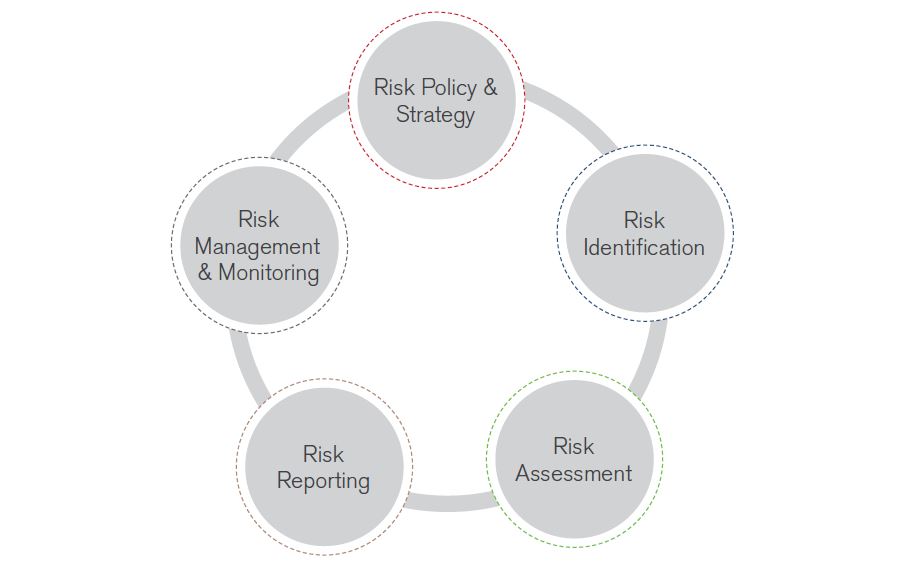
Risk Policy and Strategy: The Board is responsible for ensuring that senior management takes steps to identify measure, monitor and control all risks encountered by the Bank according to the laid down policies/ Operational risk framework. The Bank’s policy on treating Operational Risk and the Risk Framework are approved by the Board of Directors and reviewed annually.
Risk Identification: Risks that have the potential to impact the Bank are identified through analysis of internal factors, such as key control lapses and external factors such as environmental threats.
Risk Assessment: Once identified, the potential impact of the risks to the Bank is quantified using the operational risk grading matrix as defined in the policy. Risks are assigned risk grades (High, Medium and Low) based on the assessment of the likelihood and impact of the risks.
Risk Reporting: Periodic reports are prepared detailing out the risks faced by the Bank ensuring timely escalation mechanisms.
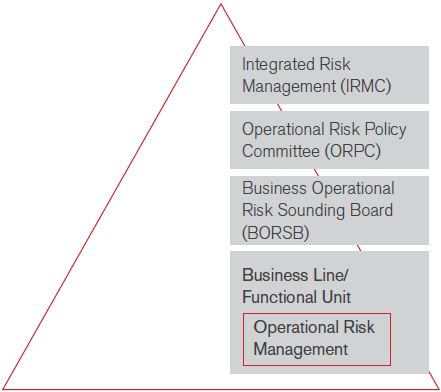
Business Operational Risk Sounding Boards have been set up at key Business and Support function levels to discuss operational risk matters on a monthly basis encompassing responsibilities. The unresolved or risks that require attention of Senior Management is brought to the notice of the Senior Management representatives at the Operational Risk Policy Committee meeting, once in every two months.
Risk Management and Monitoring: Actions to mitigate or control identified risks are prioritized based on the assessed impact. Appropriate action plans are established to mitigate, avoid, accept or transfer the risks to fall within the Bank’s risk appetite as decided by the Senior Management. This involves periodic re-assessment of risk grades to capture changes in environment that may increase or decrease potential impact of the risks.
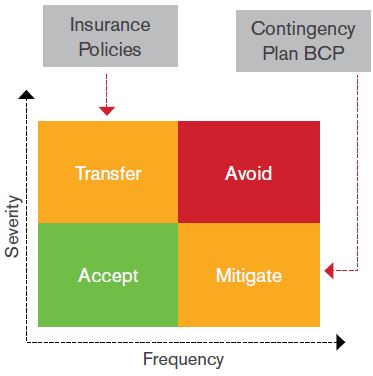
Transfer Strategies
Insurance Policies – Comprehensive policies have been obtained to cover operational lapses which may occur as a result of events such as errors and omissions, physical loss of securities, frauds and natural disasters.
Outsourcing - The Bank is concerned and committed to ensuring that the outsourced parties continue to uphold and extend a high standard of customer care and service excellence. Hence, due diligence tests are routinely carried out to assess the performance of these outsourced parties through a sub-committee established to monitor outsource activities for the Bank.
Mitigate Strategies
Contingency Plan - In order to cover the risks of crisis that threaten the safety of staff, customers and service providers, the security of assets, the continuity of operations and confidence in the Bank’s reputation, the Bank’s Business Continuity Management Policy requires that a full set of up to date and exercised plans be in place encompassing a minimum of Crisis Management Plan (CMP), Business Continuity Plan (BCP) and IT Disaster Recovery Plan (IT DRP) amongst other relevant plans.
Operational risk management practices have been automated with the implementation of the NDB Operational Risk Management System (NORMS). The users report incidents instantaneously assigning owners for mitigation with defined target dates, carryout Risk and Control Self Assessments, and monitoring of Key Risk Indicators.
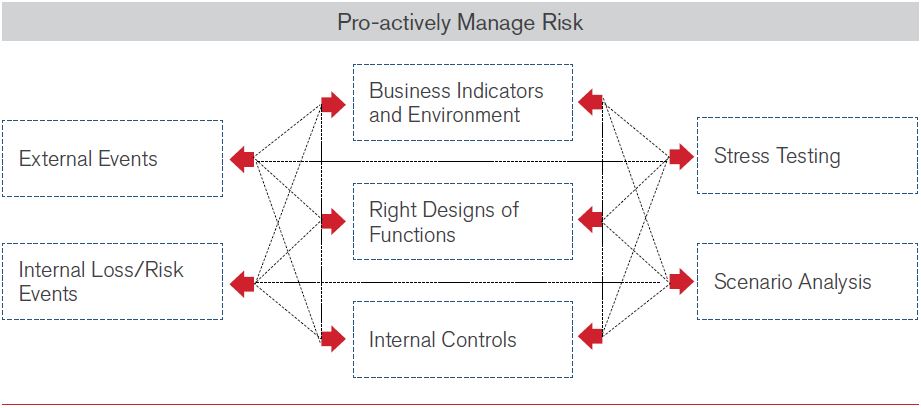
Operational Risk Management is an integral part of the Bank’s daily activities and managed with the oversight of Board and Senior Management. This end to end process ensures operational risks are effectively managed from the time they are identified to the time the risks are mitigated to fall within the risk appetite of the Bank. It is the responsibility of everyone in the Bank. As a consequence, measures aimed at controlling operational risk are introduced throughout the organization in the following distinguished levels:
-
Individual level
-
Management control
-
Assessments carried out by specialist units such as Internal/Group Audit or Compliance
-
Assessments carried out by external parties (External Auditors and Supervisory Authorities)
Self-reporting of incidents, risks and losses is encouraged within the Bank. All self-identified and assessed risks that have been reported to Operational Risk will not qualify as an audit finding. This arrangement has resulted in an increase of event reporting over the years.
Key Risk Indicators (KRI)
The function of KRI is to allow the early detection of operational risks before actual failure occurs. It is an early warning indicator of risks, and not losses.
Regular KRI monitoring assist business line managers by providing them;
-
A quantitative, verifiable risk measurement
-
A regular assessment of the improvements or deteriorations in the risk profile and the control and the prevention environment which require particular attention or action plan.
The annual RCSA exercise is typically undertaken to comply with risk assessments which requires a firm-wide, self-analysis of operational risks. RCSA requires the documentation of risks, identifying the levels of risk (derived from an estimate of frequency and impact), and controls associated with each process conducted by the organization. Controls and mitigants that adequately counteract the risks are introduced thereby minimizing the impact and incidence of losses.
Cyber RiskIn an increasingly complex digital society where interconnected systems and innovative digital services define the operating standards for organizations, effectively managing cyber risks is proving to be a complex challenge. The fast paced adoption of technology, associated risks and the constant probing of financially motivated cyber adversaries to find weaknesses to exploit and gain a foothold within the digital infrastructure of financial institutions has become the new norm.
Understanding this challenge, the Bank strives to invest in updating its digital defenses to meet the challenges of the evolving cyber threat landscape. The Bank has continued to collaborate with financial sector threat intelligence provider and engage third parties to review information technology implementations and IT operational practices to identify improvements.
Business Continuity Management
The Banks’ Business Continuity Management (BCM) Policy requires that a full set of up to date and exercised plans be in place encompassing a minimum of a Crisis Management Plan (CMP), Business Continuity Plan (BCP) and IT Disaster Recovery Plan (IT DRP). This BCM Framework is designed to comply with the requirements of the Central Bank of Sri Lanka and is approved by the Board of Directors.
These plans are drawn upon integrating Enterprise Risk Management (ERM) Framework with effective Business Impact Analysis (BIA) processes and methodologies which anticipate all forms of threats, crisis and disasters that are inherent in the ever changing Business Environment.
These plans are tested biannually at the Banks’ fully equipped Disaster Recovery Site to ensure capability and resilience to business disruption.
The Governance of Business Continuity Management is steered through the Crisis Management Team comprising of senior management and coordinated by the Bank's Business Continuity Manager.
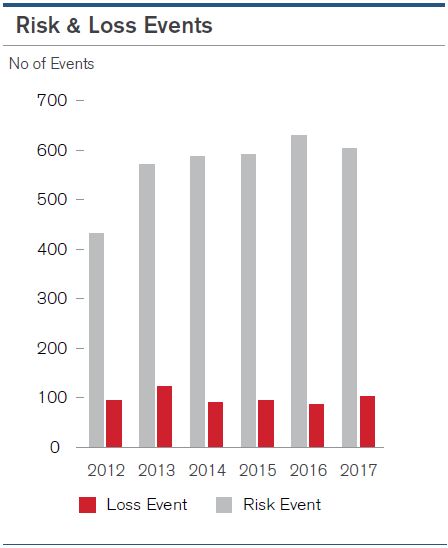
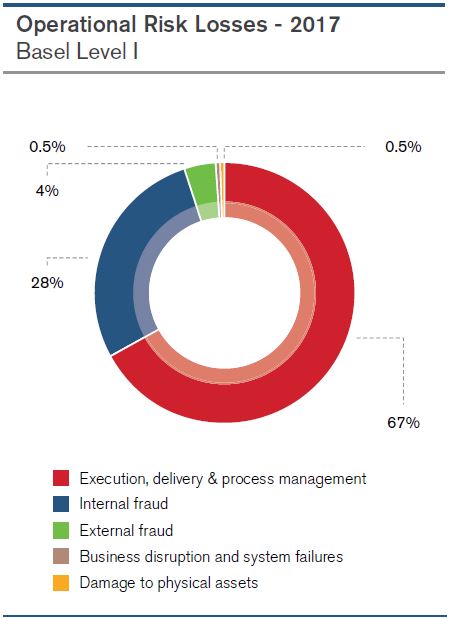
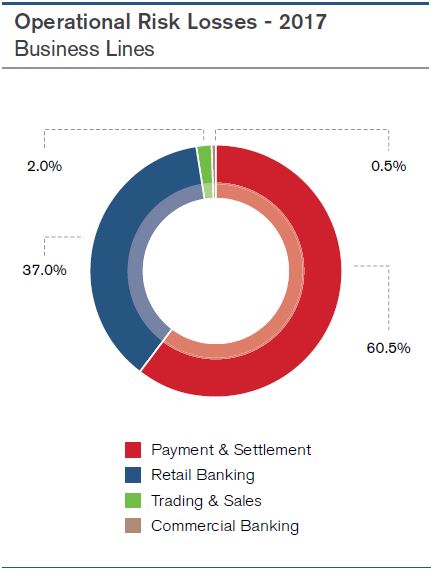
Insurance Cover in Operational Risk Management
The Bank has a comprehensive insurance policy as a key measure to mitigate aspects of operational risks. This falls within the framework of risk mitigation and control which in turn is an integral component of the risk management framework of the Bank. This Policy will be reviewed and further enhanced on an on-going basis. The Bank has engaged an insurance broker to source terms, evaluate and add value using their expertise.
Description of Coverage
General Risks
Buildings and their contents, including IT equipment, are insured at their replacement value. Liability policies are arranged separately which includes Professional Indemnity, Directors & Officers Liability & Public Liability which are covered by respective insurance policies where levels of cover are insured for having assessed the likely exposure of the bank to such areas of risks.
Theft/Fraud
These risks are included in the “Bankers’ Indemnity Insurance Policy” that insures all the Bank’s financial activities around the country. Fraudulent actions by an employee or by a third party acting on its own or with the aid of an employee with the intent to obtain illicit personal gain or through malice are covered.
Professional Liability
The consequences of any legal action against staff or managers as a result of their professional activity are insured under the Bank’s Professional Indemnity Policy.
Computer Crime
The adverse consequences surfacing while using computer systems and software are covered by the Banks Computer Crime Insurance Policy. The policy covers fraudulent input and modification via computer systems, electronic computer programs, electronic data and media, computer viruses, electronic and telefacsimile communications, electronic transmissions, electronic securities and voice incinerated transfers.
Operational Losses
The Bank's operational losses relating to low frequency, high severity events such as physical loss, fraud, natural disasters, liabilities to third parties, errors and omissions etc are covered by a comprehensive portfolio of insurance policies.
OTHER RISKS
Strategic Risk
Strategic Risk is the most fundamental of business risks and at its very basic, can be defined as the current and prospective risk to earnings and viability arising from,
-
Adverse changes in business environment with respect to the economy, political landscape, regulations, technology, actions of competitors
-
Adverse business decisions
-
Improper implementation of decisions
-
Lack of responsiveness to changes in the business environment
Strategic risk for a bank can manifest itself through lack of well-defined long-term strategy but more importantly because of failure to appropriately communicate and implement the strategy or due to unforeseen changes in the socio-political, economic or business environment. Drawing of appropriate response plans to tweak the strategy to suit the changes in the business environment is essential to management of strategic risk.
This year a new strategic plan was formulated by the Board for the Bank to become one of the largest Banks in Sri Lanka by 2020. The strategic plans are drawn at various level of granularity e.g. a branch level strategy will detail the growth targets at branch level whereas a department level strategy will feature the achievement metrics at that level. The implementation of strategy is checked through monthly meetings where variances from the growth targets are analyzed and corrective actions recommended.
The Strategic Plan is also linked to individual employee performance through a goal setting process and periodic performance reviews are carried out to motivate employees and create a performance culture to ensure that business goals and objectives are achieved, thus mitigating strategic risk.
Cross-Border Risk
Cross-border risk is the risk that the Bank will be unable to obtain payments from its customers or third parties on their contractual obligations as a result of certain actions taken by foreign governments, mainly relating to convertibility and transferability of foreign currency and geo-political factors.
Correspondent Banking Unit is responsible for Bank’s cross-border exposures and management of exposure limits. Crossborder assets comprise loans and advances, interest-bearing deposits with other banks, trade and other bills, acceptances, Foreign Exchange contracts, investment securities and formal commitments where the counterparty is resident in a country other than where the assets are recorded. Cross-border exposure also includes the assets owned by the Bank/ Group that are held in a given country.
The Bank has a Board approved policy/ limits based on external ratings of countries for routine banking transactions with tenors less than one year. In the event the Bank decides to make any long term investments/ lending (tenor over 1 year) off shore, the Bank undertakes a detailed due diligence covering the following key areas:-
-
Country Ratings
-
Economic Indicators and Outlook
-
Political Risk
-
Exchange Rate Risk (convertibility/ transferability)
-
Banking/Financial sector
The business lines and back offices manage the exposures within these limits and policies. Countries designated as higher risk are subject to increased central monitoring. Cross-border exposure limits are allocated to countries in which the Bank does have an acceptable risk appetite and one-off limits may be allocated based on business needs, with ultimate recourse to the borrower.
Legal risk is understood more from its consequences, which is incurrence of penalties, fines and sometimes loss of reputation due to the institution being on the other side of law. Legal risk may vary from institution to institution depending on the manner in which it conducts its business and the documentation it follows and is closely related to compliance and regulatory risk.
Legal risk in the Bank can manifest itself through,
-
Business not being conducted in accordance with applicable laws
-
Inadequate legal documentation of securities and collateral accepted for credit risk mitigation
-
Legal repercussions of lacuna in documents, forms, advertisements
-
Other modes of conduct and communication adopted by the Bank
-
Intellectual property not being adequately protected.
Legal risk is owned and managed by the Legal Department and the Legal Department is assisted by third party lawyers as and when necessary to obtain an independent opinion. Specific risks relating to legal risk are reported on a monthly basis to the Board.
Compliance RiskVery closely related with reputational and legal/regulatory risk, compliance risk is defined as the risk of legal or regulatory sanctions, material financial loss, or loss to reputation and integrity an institution may suffer as a result of its failure to comply with laws, regulations, rules, related self-regulatory organizational standards, and codes of conduct applicable to its business activities. Bank is compliant with all CBSL regulations.
The Bank has a well laid out Board approved Compliance Charter, which defines the fundamental principles, roles and responsibilities of the compliance function within the organization as well as its relationship with the business and operational functions, senior management and the Board of Directors.
Model Risk
Board has put in place a risk model validation policy to mitigate model risk of the Bank. Bank completed third party validation of risk models during the year in line with the Board approved policy.
Settlement Risk
Settlement Risk refers to the risk arising on account of failed trades with counterparty banks in the foreign currency transactions. Settlement Risk arises from possible losses when the Bank is in a foreign exchange transaction pays the currency it sold but does not receive the currency it bought. Forward Contract settlement failures can arise from counterparty default, operational problems, and other factors. Settlement risk exists for any traded product. Currently, the Bank has a procedure for regular monitoring of limit utilization, failed trades & excess monitoring. Settlement Risk is currently controlled by way of prudent allocation and monitoring of counterparty limits including Maximum Daily Delivery Risks (MDDR) limits for counterparts.
Governance Risk
Corporate governance is understood as the system by which the Bank is directed and controlled. The Board of Directors is responsible for the governance of the Bank. The responsibilities of the Board include setting out the Bank’s strategic aims, providing leadership to operationalize same, supervising the management of the business and reporting to shareholders on their stewardship.
Bank’s Corporate Governance framework has been developed with the objective of balancing the attainment of corporate objectives of the Bank whilst at the same time aligning corporate behaviours with the expectations of society and being accountable to its shareholders.
Please refer the Corporate Governance Report found in this annual report for more details on the Bank’s Corporate Governance framework.
Reputational Risk
Reputational risk is risk of indirect loss (current or prospective) arising from one or multiple stakeholders’ adverse experience while dealing with the institution or which resulted in an adverse perception of the
institution. It can also be understood as the potential that negative publicity regarding the Bank’s business practices, whether true or not, will cause a decline in customer base, costly litigation or revenue reduction. The Bank is of the view that reputational risk can be triggered by a risk event in any or all of the above risk categories hitherto described.
Reputational risk management and mitigation aspects are embedded in the Bank’s policies and procedures, training programs, the Business Continuity Plan and through the Audit and Board Risk Management Committees.
The Bank monitors its reputational risk profile through a set of early warning indicators based on the reputational risk drivers and the factors within the reputational risk scorecard ensure that the overall reputational risk profile remains acceptable. The risk mitigation and control processes for reputational risk are designed to consider appropriate response actions to address the risks identified. A Customer Complaint Handling Process has been established under which the customers have a range of options through which they can forward their grievances to the Bank, by way of letters, using our public help line that is manned on a 24 hour basis, through the Bank web-site or social media.
Group Risk
The Bank together with its subsidiaries, in the process of financial intermediation are confronted with various kinds of financial and non-financial risks such as credit, interest rate, foreign exchange rate, liquidity, equity price, commodity price, legal, regulatory, reputational, operational, etc. These risks are highly interdependent and events that affect one area of risk can have consequences on a range of other risk categories. Thus, considerable importance is given to improve the ability to identify, measure, monitor and control the overall level of risks undertaken.
Aggregating the risks of Group Companies remains a challenge due to their diverse business models and risk profiles. The Group Companies are engaged in investment banking, capital market activities, unit trust management and property management activities. However, the Bank believes the ‘Group Risk’ is greatly mitigated as;
-
NDB’s capital at risk is limited to the amount invested in these companies in the form of equity, at the time the companies were incorporated.
-
There is representation by NDB’s Directors/Key Management Personnel on the Boards of Directors/Board Audit, Risk and Compliance Committees of its subsidiaries, thereby ensuring full and sufficient knowledge of subsidiaries’ operations and risk profiles.
-
Due to the governance structure mandated by the laws governing banking and limited liability companies, all inter-company transactions are at arms-length and full disclosure of such transactions is made.
-
Natural mitigation from the fact that the Bank is the holding company and owns the largest balance sheet in the group.
-
NDB Securities Limited and NDB Wealth Management Limited being licensed stock brokers and Unit Trust Managers are regulated by the SEC.
-
Risk Reporting framework by group companies to Centralized Group Risk Management of NDB/IRMC/Board for review/corrective action.
Each Group Company remains responsible for the management of risks, including associated controls and on-going monitoring processes. Risks identified by Group companies are reported to Group Risk Management department on a monthly basis through appropriate risk indicators (using a Risk Dashboard) and management information for review and escalation. Top risks and associated mitigants are also highlighted. The main risk categories being reviewed are as follows:-
-
Investment/Credit Risk
-
Operational Risk
-
Market Risk
-
Liquidity Risk
-
Interest Rate Risk
-
Concentration Risk
-
Regulatory/Compliance Risk
-
Legal/Reputational Risk
-
Strategic Risk
-
Any other risks relevant to the specific line of business of the Group Company
All Group Companies are required to have relevant policies and limits for monitoring purposes and to ensure that risks are within acceptable levels/ in line with risk appetite. All risk related policies of the Group companies are vetted by Group Risk Management department to ensure compliance with the Regulatory requirements and internal policies applicable to the Bank. Furthermore, the Operational Risk Management Unit within the Group Risk Management department conducts Risk and Control Self Assessments for the Group companies and this process facilitates informed decision-making by providing management with an overall view of operational risks within a business process.
FUTURE OF RISK MANAGEMENT
The Bank's risk management capabilities have progressed encouragingly towards best in class, and will continue to be strengthened and enhanced to create value and be a competitive advantage to support the Group’s aspirations.
BASEL III - PILLAR III MARKET DISCIPLINE DISCLOSURES
Commencing from 01 July 2017, all Licensed banks are required to compute capital ratios based on the Basel III guidelines issued by the Central Bank of Sri Lanka. As per the Basel III guidelines, it is required to disclose Pillar III Market discipline disclosure requirements laid out in the Banking Act Direction No. 01 of 2016.
Pillar III Market Discipline disclosures of the Bank and the Group for the year ended 31 December 2017 are given below.
1. Regulatory Requirements on Capital and Liquidity
1.(a) Key Regulatory Ratios - Capital and Liquidity
|
As at 31 December 2017 |
As at 31 December 2016 |
|||
|
BASEL III |
BASEL II |
|||
|
Item |
Bank |
Group |
Bank |
Group |
|
Regulatory Capital (LKR ’000) |
|
|
||
|
Common Equity Tier 1 Capital |
24,424,734 |
29,859,223 |
N/A |
N/A |
|
Tier 1 Capital |
24,424,734 |
29,859,223 |
22,403,746 |
29,107,947 |
|
Total Capital |
38,304,758 |
43,189,555 |
31,153,003 |
38,483,861 |
|
Regulatory Capital Ratios (%) |
|
|
||
|
Common Equity Tier 1 Capital Ratio (Minimum Requirement - 5.75%) |
8.85 |
10.49 |
N/A |
N/A |
|
Tier 1 Capital Ratio (Minimum Requirement - 7.25%) |
8.85 |
10.49 |
9.31 |
11.55 |
|
Total Capital Ratio (Minimum Requirement - 11.25%) |
13.89 |
15.18 |
12.95 |
15.27 |
|
Regulatory Liquidity |
|
|
||
|
Statutory Liquid Assets (LKR ’000) |
77,506,348 |
NA |
67,105,194 |
N/A |
|
Statutory Liquid Assets Ratio (Minimum Requirement - 20%) |
|
|
||
|
Domestic Banking Unit (%) |
22.13 |
NA |
21,50 |
N/A |
|
Off-Shore Banking Unit (%) |
24.01 |
NA |
22.93 |
N/A |
|
Liquidity Coverage Ratio (%) – Rupee (Minimum Requirement - 80%) |
214.35 |
NA |
142.53 |
N/A |
|
Liquidity Coverage Ratio (%) – All Currency (Minimum Requirement - 80%) |
154.50 |
NA |
125.63 |
N/A |
As per the above reported ratios for Capital, the Bank and the Group comply with the minimum requirements for capital ratios as of 01 January 2018.
1.(b) Basel III Computation of Capital Ratios
|
As at 31 December 2017 |
||
|
Item |
Bank LKR '000 |
Group LKR '000 |
|
Common Equity Tier 1 (CET1) Capital after Adjustments |
24,424,734 |
29,859,223 |
|
Common Equity Tier 1 (CET1) Capital |
27,696,573 |
31,875,573 |
|
Equity Capital (Stated Capital)/Assigned Capital |
2,208,520 |
2,208,520 |
|
Reserve Fund |
1,336,479 |
1,336,479 |
|
Published Retained Earnings/(Accumulated Retained Losses) |
18,585,254 |
22,775,440 |
|
Published Accumulated Other Comprehensive Income (OCI) |
(239,387) |
(250,573) |
|
General and other Disclosed Reserves |
5,805,707 |
5,805,707 |
|
Unpublished Current Year’s Profit/Loss and Gains reflected in OCI |
- |
- |
|
Ordinary Shares issued by Consolidated Banking and Financial Subsidiaries of the Bank and held by Third Parties |
- |
- |
|
Total Adjustments to CET1 Capital |
3,271,839 |
2,016,350 |
|
Goodwill (net) |
- |
- |
|
Intangible Assets (net) |
384,369 |
397,053 |
|
Defined benefit pension fund assets |
129,662 |
129,662 |
|
Investments in the capital of banking and financial institutions where the bank does not own more than 10 per cent of the issued ordinary share capital of the entity |
1,122,016 |
1,489,635 |
|
Significant investments in the capital of financial institutions where the bank owns more than 10 per cent of the issued ordinary share capital of the entity |
1,635,792 |
- |
|
Additional Tier 1 (AT1) Capital after Adjustments |
- |
- |
|
Additional Tier 1 (AT1) Capital |
- |
- |
|
Qualifying Additional Tier 1 Capital Instruments |
- |
- |
|
Instruments issued by Consolidated Banking and Financial Subsidiaries of the Bank and held by Third Parties |
- |
- |
|
Total Adjustments to AT1 Capital |
- |
- |
|
Investment in Own Shares |
- |
- |
|
Others (specify) |
- |
- |
|
Tier 2 Capital after Adjustments |
13,880,024 |
13,330,332 |
|
Tier 2 Capital |
13,880,024 |
13,880,024 |
|
Qualifying Tier 2 Capital Instruments |
12,212,368 |
12,212,368 |
|
Revaluation Gains |
542,092 |
542,092 |
|
Loan Loss Provisions |
1,125,564 |
1,125,564 |
|
Instruments issued by Consolidated Banking and Financial Subsidiaries of the Bank and held by Third Parties |
- |
- |
|
Total Adjustments to Tier 2 |
- |
549,692 |
|
Investment in Own Shares |
- |
- |
|
Others- Investments in the capital of financial institutions and where the bank does not own more than 10 per cent of the issued capital carrying voting rights of the issuing entity |
- |
549,692 |
|
CET1 Capital |
24,424,734 |
29,859,223 |
|
Total Tier 1 Capital |
24,424,734 |
29,859,223 |
|
Total Capital |
38,304,758 |
43,189,555 |
|
Total Risk Weighted Assets (RWA) |
275,852,129 |
284,519,116 |
|
RWAs for Credit Risk |
248,519,093 |
253,454,095 |
|
RWAs for Market Risk |
9,195,023 |
12,072,722 |
|
RWAs for Operational Risk |
18,138,013 |
18,992,299 |
|
CET1 Capital Ratio (including Capital Conservation Buffer, Countercyclical Capital Buffer & Surcharge on D-SIBs) (%) |
8.85 |
10.49 |
|
of which: Capital Conservation Buffer (%) |
1.25 |
1.25 |
|
of which: Countercyclical Buffer (%) |
- |
- |
|
of which: Capital Surcharge on D-SIBs (%) |
- |
- |
|
Total Tier 1 Capital Ratio (%) |
8.85 |
10.49 |
|
Total Capital Ratio (including Capital Conservation Buffer, Countercyclical Capital Buffer & Surcharge on D-SIBs) (%) |
13.89 |
15.18 |
|
of which: Capital Conservation Buffer (%) |
1.25 |
1.25 |
|
of which: Countercyclical Buffer (%) |
- |
- |
|
of which: Capital Surcharge on D-SIBs (%) |
- |
- |
1.(c) Basel III Computation of Liquidity Coverage Ratio - All Currency Liquidity Requirement
|
Bank |
||||
|
Item |
Amount (LKR’000) |
|||
|
As at 31 December 2017 |
As at 31 December 2016 |
|||
|
Total Un-weighted Value |
Total Weighted Value |
Total Un-weighted Value |
Total Weighted Value |
|
|
Total Stock of High-Quality Liquid Assets (HQLA) |
52,654,215 |
51,901,650 |
16,900,369 |
16,194,497 |
|
Total Adjusted Level 1A Assets |
51,497,371 |
51,497,371 |
15,039,239 |
15,039,239 |
|
Level 1 Assets |
51,149,085 |
51,149,085 |
15,039,239 |
15,039,239 |
|
Total Adjusted Level 2A Assets |
- |
- |
641,980 |
545,683 |
|
Level 2A Assets |
- |
- |
641,980 |
545,683 |
|
Total Adjusted Level 2B Assets |
1,505,130 |
752,565 |
1,219,150 |
609,575 |
|
Level 2B Assets |
1,505,130 |
752,565 |
1,219,150 |
609,575 |
|
Total Cash Outflows |
415,875,076 |
79,306,701 |
370,806,114 |
51,562,903 |
|
Deposits |
169,266,672 |
12,024,091 |
162,486,320 |
4,557,534 |
|
Unsecured Wholesale Funding |
121,018,123 |
64,833,008 |
74,434,844 |
38,464,565 |
|
Secured Funding Transactions |
3,629,320 |
- |
18,107,059 |
- |
|
Undrawn Portion of Committed (Irrevocable) Facilities and Other Contingent Funding Obligations |
121,960,961 |
2,449,602 |
115,777,891 |
8,540,804 |
|
Additional Requirements |
- |
- |
- |
- |
|
Total Cash Inflows |
73,685,468 |
45,713,580 |
89,924,107 |
42,376,618 |
|
Maturing Secured Lending Transactions Backed by Collateral |
29,206,561 |
21,340,667 |
56,044,699 |
23,115,806 |
|
Committed Facilities |
- |
- |
- |
- |
|
Other Inflows by Counterparty which are Maturing within |
42,115,292 |
24,372,913 |
31,525,509 |
19,260,812 |
|
Operational Deposits |
2,363,615 |
- |
2,353,899 |
- |
|
Other Cash Inflows |
- |
- |
- |
- |
|
Liquidity Coverage Ratio (%) (Stock of High Quality Liquid Assets/Total Net Cash Outflows over the Next 30 Calendar Days) * 100 |
|
154.50% |
|
125.63% |
1.(d) Main Features of Regulatory Capital Instruments - Bank and Group
|
Description of the Capital Instrument |
CET 1 Capital |
Tier 2 Instruments |
|
|
Stated Capital |
Debenture Issue 1 (2013) |
Debenture Issue 2 (2015) |
|
|
Issuer |
National Development Bank PLC |
National Development Bank PLC |
National Development Bank PLC |
|
Unique Identifier (e.g., ISIN or Bloomberg Identifier for Private Placement) |
NDB. N0000 ISIN -LK0207N00007 |
Type A - LK0207D20998 Type B - LK0207D21012 Type C - LK0207D21038 Type D - LK0207D21053 |
Type A - LK0207D23091 Type B - LK0207D23083 |
|
Governing Law(s) of the Instrument |
Companies Act No. 07 of 2007, Rules of the Colombo Stock Exchange, Securities and Exchange Commission Act |
Companies Act No. 07 of 2007, Rules of the Colombo Stock Exchange, Securities and Exchange Commission Act |
Companies Act No. 07 of 2007, Rules of the Colombo Stock Exchange, Securities and Exchange Commission Act |
|
Original Date of Issuance |
Date listed 26-Apr-1993 |
19-Dec-2013 |
24-Jun-2015 |
|
Par Value of Instrument |
NA |
LKR 100/- |
LKR 100/- |
|
Perpetual or Dated |
Perpetual |
Dated |
Dated |
|
Original Maturity Date, if Applicable |
NA |
Type A - 19 Dec 2018 Type B - 19 Dec 2018 Type C - 19 Dec 2023 Type D - 19 Dec 2025 |
Type A - 24 Jun 2020 Type B - 24 Jun 2020 |
|
Amount Recognised in Regulatory Capital (in LKR ‘000 as at 31 Dec 2017) |
2,208,520 |
7,782,728 |
4,429,640 |
|
Accounting Classification (Equity/Liability) |
Equity |
Liability |
Liability |
|
Issuer Call subject to Prior Supervisory Approval |
|
|
|
|
Optional Call Date, Contingent Call Dates and Redemption Amount (LKR ‘000) |
NA |
NA |
NA |
|
Subsequent Call Dates, if Applicable |
NA |
NA |
NA |
|
Coupons/Dividends |
|
|
|
|
Fixed or Floating Dividend/Coupon |
Dividend declared as decided by the Board |
Fixed coupon |
Fixed coupon |
|
Coupon Rate and any Related Index |
NA |
Type A - 13.0% p.a Type B - 13.4% p.a Type C - 13.9% p.a Type D - 14.0% p.a |
Type A - 9.4% p.a Type B - Zero coupon bonds |
|
Non-Cumulative or Cumulative |
NA |
Non-cumulative |
Non-cumulative |
|
Convertible or Non-Convertible |
|
|
|
|
If Convertible, Conversion Trigger (s) |
NA |
NA |
NA |
|
If Convertible, Fully or Partially |
NA |
NA |
NA |
|
If Convertible, Mandatory or Optional |
NA |
NA |
NA |
|
If Convertible, Conversion Rate |
NA |
NA |
NA |
2. Risk Weighted Assets (RWA)
2.(a) Summary discussion on adequacy/meeting current and future capital
requirements.
Please refer page 138 for the Capital Management section.
2.(b) Credit Risk under Standardized Approach - Credit Risk Exposures and Credit Risk Mitigation (CRM) Effects
|
Asset Class |
Bank |
|||||
|
Amount (LKR’000) as at 31 December 2017 |
||||||
|
Exposures before Credit Conversion Factor (CCF) and CRM |
Exposures post CCF and CRM |
RWA and RWA Density (%) |
||||
|
On-Balance Sheet Amount |
Off-Balance Sheet Amount |
On-Balance Sheet Amount |
Off-Balance Sheet Amount |
RWA |
RWA Density(ii) |
|
|
Claims on Central Government and Central Bank of Sri Lanka |
37,823,561 |
7,272,250 |
37,823,561 |
1,485,312 |
- |
- |
|
Claims on Foreign Sovereigns and their Central Banks |
- |
- |
- |
- |
- |
- |
|
Claims on Public Sector Entities |
14,259,805 |
2,587,874 |
- |
- |
- |
- |
|
Claims on Official Entities and Multilateral Development Banks |
- |
- |
- |
- |
- |
- |
|
Claims on Banks Exposures |
4,708,600 |
70,725,699 |
4,708,600 |
4,163,901 |
4,296,192 |
48.42% |
|
Claims on Financial Institutions |
18,823,256 |
25,447,396 |
18,823,256 |
433,713 |
10,416,661 |
54.09% |
|
Claims on Corporates |
141,859,060 |
139,784,926 |
134,757,649 |
27,165,784 |
158,434,016 |
97.85% |
|
Retail Claims |
87,347,816 |
16,423,542 |
75,330,691 |
1,641,962 |
59,278,058 |
77.01% |
|
Claims Secured by Residential Property |
11,596,012 |
268,322 |
11,587,274 |
89,778 |
6,325,724 |
54.17% |
|
Claims Secured by Commercial Real Estate |
- |
- |
- |
- |
- |
- |
|
Non-Performing Assets (NPAs)(i) |
2,959,435 |
- |
2,616,746 |
- |
3,624,952 |
138.53% |
|
Higher-risk Categories |
260,605 |
- |
260,605 |
- |
651,513 |
250.00% |
|
Cash Items and Other Assets |
8,459,976 |
- |
8,459,976 |
- |
5,491,977 |
64.92% |
|
Total |
328,098,126 |
262,510,009 |
294,368,358 |
34,980,450 |
248,519,093 |
|
2.(b) Credit Risk under Standardized Approach - Credit Risk Exposures and Credit Risk Mitigation (CRM) Effects (Contd.)
|
Asset Class |
GROUP |
|||||
|
Amount (LKR’000) as at 31 December 2017 |
||||||
|
Exposures before Credit Conversion Factor (CCF) and CRM |
Exposures post CCF and CRM |
RWA and RWA Density (%) |
||||
|
On-Balance Sheet Amount |
Off-Balance Sheet Amount |
On-Balance Sheet Amount |
Off-Balance Sheet Amount |
RWA |
RWA Density(ii) |
|
|
Claims on Central Government and Central Bank of Sri Lanka |
37,823,561 |
7,272,250 |
37,823,561 |
1,485,312 |
- |
- |
|
Claims on Foreign Sovereigns and their Central Banks |
- |
- |
- |
- |
- |
- |
|
Claims on Public Sector Entities |
14,259,805 |
2,587,874 |
- |
- |
- |
- |
|
Claims on Official Entities and Multilateral Development Banks |
- |
- |
- |
- |
- |
- |
|
Claims on Banks Exposures |
5,124,798 |
70,725,699 |
5,124,798 |
4,163,901 |
4,506,399 |
48.51% |
|
Claims on Financial Institutions |
19,398,219 |
25,447,396 |
19,398,219 |
433,713 |
10,756,158 |
54.24% |
|
Claims on Corporates |
142,518,282 |
139,219,922 |
135,416,871 |
27,119,833 |
158,807,831 |
97.71% |
|
Retail Claims |
87,347,816 |
16,423,542 |
75,330,691 |
1,641,962 |
59,278,058 |
77.01% |
|
Claims Secured by Residential Property |
11,596,012 |
268,322 |
11,587,274 |
89,778 |
6,325,724 |
54.17% |
|
Claims Secured by Commercial Real Estate |
- |
- |
- |
- |
- |
- |
|
Non-Performing Assets (NPAs)(i) |
2,959,435 |
- |
2,616,746 |
- |
3,624,952 |
138.53% |
|
Higher-risk Categories |
420,996 |
1,282,454 |
420,996 |
641,227 |
1,626,638 |
153.14% |
|
Cash Items and Other Assets |
11,496,459 |
- |
11,496,459 |
- |
8,528,335 |
74.18% |
|
Total |
332,945,383 |
263,227,459 |
299,215,615 |
35,575,726 |
253,454,095 |
|
Note -
(i) NPAs - As per Banking Act Direction on classification of loans and advances, income
recognition and provisioning.
(ii) RWA Density - Total RWA / Exposures post CCF and CRM
2.(c) Credit Risk under Standardized Approach: Exposures by Asset Classes and Risk Weights
|
BANK |
|||||||||
|
Description |
Amount (LKR’000) as at 31 December 2017 (Post CCF & CRM) |
||||||||
|
Asset Classes |
Risk Weight |
0% |
20% |
50% |
75% |
100% |
150% |
>150% |
Total Credit Exposures Amount |
|
Claims on Central Government and Central Bank of Sri Lanka |
39,308,873 |
- |
- |
- |
- |
- |
- |
39,308,873 |
|
|
Claims on Foreign Sovereigns and their Central Banks |
- |
- |
- |
- |
- |
- |
- |
- |
|
|
Claims on Public Sector Entities |
- |
- |
- |
- |
- |
- |
- |
- |
|
|
Claims on Official Entities and Multilateral Development Banks |
- |
- |
- |
- |
- |
- |
- |
- |
|
|
Claims on Banks Exposures |
- |
3,576,374 |
3,518,586 |
- |
1,689,373 |
88,168 |
- |
8,872,501 |
|
|
Claims on Financial Institutions |
- |
3,922,288 |
11,404,955 |
- |
3,929,726 |
- |
- |
19,256,969 |
|
|
Claims on Corporates |
- |
1,926,448 |
3,998,008 |
- |
155,897,484 |
101,492 |
- |
161,923,432 |
|
|
Retail Claims |
97,184 |
74,064 |
- |
70,152,638 |
6,648,767 |
- |
- |
76,972,653 |
|
|
Claims Secured by Residential Property |
- |
- |
10,702,657 |
- |
974,396 |
- |
- |
11,677,053 |
|
|
Claims Secured by Commercial Real Estate |
- |
- |
- |
- |
- |
- |
- |
- |
|
|
Non-Performing Assets (NPAs) |
- |
- |
18,493 |
- |
563,348 |
2,034,905 |
- |
2,616,746 |
|
|
Higher-risk Categories |
- |
- |
- |
- |
- |
- |
260,605 |
260,605 |
|
|
Cash Items and Other Assets |
2,801,793 |
207,758 |
- |
- |
5,450,425 |
- |
- |
8,459,976 |
|
|
Total |
42,207,850 |
9,706,932 |
29,642,699 |
70,152,638 |
175,153,519 |
2,224,565 |
260,605 |
329,348,808 |
|
|
GROUP |
|||||||||
|
Description |
Amount (LKR’000) as at 31 December 2017 (Post CCF & CRM) |
||||||||
|
Asset Classes |
Risk Weight |
0% |
20% |
50% |
75% |
100% |
150% |
>150% |
Total Credit Exposures Amount |
|
Claims on Central Government and Central Bank of Sri Lanka |
39,308,873 |
- |
- |
- |
- |
- |
- |
39,308,873 |
|
|
Claims on Foreign Sovereigns and their Central Banks |
- |
- |
- |
- |
- |
- |
- |
- |
|
|
Claims on Public Sector Entities |
- |
- |
- |
- |
- |
- |
- |
- |
|
|
Claims on Official Entities and Multilateral Development Banks |
- |
- |
- |
- |
- |
- |
- |
- |
|
|
Claims on Banks Exposures |
- |
3,569,346 |
3,941,812 |
- |
1,689,373 |
88,168 |
- |
9,288,699 |
|
|
Claims on Financial Institutions |
- |
3,950,613 |
11,830,567 |
- |
4,050,752 |
- |
- |
19,831,932 |
|
|
Claims on Corporates |
- |
1,926,448 |
4,476,920 |
- |
156,031,843 |
101,492 |
- |
162,536,703 |
|
|
Retail Claims |
97,184 |
74,064 |
- |
70,152,638 |
6,648,767 |
- |
- |
76,972,653 |
|
|
Claims Secured by Residential Property |
- |
- |
10,702,657 |
- |
974,396 |
- |
- |
11,677,053 |
|
|
Claims Secured by Commercial Real Estate |
- |
- |
- |
- |
- |
- |
- |
- |
|
|
Non-Performing Assets (NPAs) |
- |
- |
18,493 |
- |
563,348 |
2,034,905 |
- |
2,616,746 |
|
|
Higher-risk Categories |
- |
- |
- |
- |
|
1,028,919 |
33,304 |
1,062,223 |
|
|
Cash Items and Other Assets |
2,801,888 |
207,796 |
- |
- |
8,486,775 |
- |
- |
11,496,459 |
|
|
Total |
42,207,945 |
9,728,267 |
30,970,449 |
70,152,638 |
178,445,254 |
3,253,484 |
33,304 |
334,791,341 |
|
2.(d) Market Risk under Standardized Measurement Method
|
RWA Amount as at 31 December 2017 |
||
|
Item |
Bank LKR '000 |
Group LKR '000 |
|
(a) RWA for Interest Rate Risk |
889,920 |
889,920 |
|
General Interest Rate Risk |
889,920 |
889,920 |
|
(i) Net Long or Short Position |
889,920 |
889,920 |
|
(ii) Horizontal Disallowance |
|
|
|
(iii) Vertical Disallowance |
|
|
|
(iv) Options |
|
|
|
Specific Interest Rate Risk |
|
|
|
(b) RWA for Equity |
48,282 |
372,024 |
|
(i) General Equity Risk |
29,210 |
190,191 |
|
(ii) Specific Equity Risk |
19,072 |
181,833 |
|
(c) RWA for Foreign Exchange & Gold |
96,238 |
96,238 |
|
Capital Charge for Market Risk [(a) + (b) + (c)] * CAR |
9,195,023 |
12,072,722 |
2.(e) Operational Risk under Basic Indicator Approach
|
BANK |
|||||
|
Business Lines |
Capital Charge Factor |
Fixed Factor |
Gross Income (LKR’000) as at 31 December 2017 |
||
|
1st Year |
2nd Year |
3rd Year |
|||
|
The Basic Indicator Approach |
15% |
|
12,109,053 |
13,079,433 |
15,622,043 |
|
The Standardized Approach |
|
|
- |
- |
- |
|
Corporate Finance |
18% |
|
|
|
|
|
Trading and Sales |
18% |
|
|
|
|
|
Payment and Settlement |
18% |
|
|
|
|
|
Agency Services |
15% |
|
|
|
|
|
Asset Management |
12% |
|
|
|
|
|
Retail Brokerage |
12% |
|
|
|
|
|
Retail Banking |
12% |
|
|
|
|
|
Commercial Banking |
15% |
|
|
|
|
|
The Alternative Standardized Approach |
|
|
- |
- |
- |
|
Corporate Finance |
18% |
|
|
|
|
|
Trading and Sales |
18% |
|
|
|
|
|
Payment and Settlement |
18% |
|
|
|
|
|
Agency Services |
15% |
|
|
|
|
|
Asset Management |
12% |
|
|
|
|
|
Retail Brokerage |
12% |
|
|
|
|
|
Retail Banking |
12% |
0.035 |
|
|
|
|
Commercial Banking |
15% |
0.035 |
|
|
|
|
Capital Charges for Operational Risk (LKR ’000) |
|||||
|
The Basic Indicator Approach |
2,040,526 |
|
|||
|
The Standardized Approach |
|||||
|
The Alternative Standardized Approach |
|||||
|
Risk Weighted Amount for Operational Risk (LKR’000) |
|||||
|
The Basic Indicator Approach |
18,138,013 |
|
|||
|
The Standardized Approach |
- |
||||
|
The Alternative Standardized Approach |
- |
||||
2.(e) Operational Risk under Basic Indicator Approach (Contd.)
|
Group |
|||||
|
Business Lines |
Capital Charge Factor |
Fixed Factor |
Gross Income (LKR’000) as at 31 December 2017 |
||
|
1st Year |
2nd Year |
3rd Year |
|||
|
The Basic Indicator Approach |
15% |
|
12,979,474 |
13,602,927 |
16,150,264 |
|
The Standardized Approach |
|
|
- |
- |
- |
|
Corporate Finance |
18% |
|
|
|
|
|
Trading and Sales |
18% |
|
|
|
|
|
Payment and Settlement |
18% |
|
|
|
|
|
Agency Services |
15% |
|
|
|
|
|
Asset Management |
12% |
|
|
|
|
|
Retail Brokerage |
12% |
|
|
|
|
|
Retail Banking |
12% |
|
|
|
|
|
Commercial Banking |
15% |
|
|
|
|
|
The Alternative Standardized Approach |
|
|
- |
- |
- |
|
Corporate Finance |
18% |
|
|
|
|
|
Trading and Sales |
18% |
|
|
|
|
|
Payment and Settlement |
18% |
|
|
|
|
|
Agency Services |
15% |
|
|
|
|
|
Asset Management |
12% |
|
|
|
|
|
Retail Brokerage |
12% |
|
|
|
|
|
Retail Banking |
12% |
0.035 |
|
|
|
|
Commercial Banking |
15% |
0.035 |
|
|
|
|
Capital Charges for Operational Risk (LKR’000) |
|||||
|
The Basic Indicator Approach |
2,136,633 |
|
|||
|
The Standardized Approach |
- |
||||
|
The Alternative Standardized Approach |
- |
||||
|
Risk Weighted Amount for Operational Risk (LKR’000) |
|||||
|
The Basic Indicator Approach |
18,992,299 |
|
|||
|
The Standardized Approach |
- |
||||
|
The Alternative Standardized Approach |
- |
||||
3. Differences between Accounting and Regulatory Scopes and Mapping of Financial Statement Categories with Regulatory Risk Categories – BANK
|
Amount (LKR ‘000) as at 31 December 2017 |
||||||||
|
a |
b |
c |
d |
e |
|
|||
|
Item |
Carrying Values as Reported in Published Financial Statements |
Carrying Values under Scope of Regulatory Reporting |
Subject to Credit Risk Framework |
Subject to Market Risk Framework |
Not subject to Capital Requirements or Subject to Deduction from Capital |
Explanation on significant differences on (a) and (b) |
Measurement techniques/valuation basis |
|
|
Assets |
383,073,042 |
382,518,932 |
294,368,358 |
52,274,531 |
35,876,043 |
|
|
|
|
Cash and Cash Equivalents |
5,274,466 |
5,373,153 |
5,373,153 |
- |
- |
|
||
|
Balances with the Central Bank of |
15,364,920 |
15,364,920 |
15,364,920 |
- |
- |
|
|
|
|
Placements with Banks |
840,684 |
840,500 |
840,500 |
- |
- |
|
|
|
|
Derivative Financial Instruments |
2,471,706 |
- |
- |
- |
- |
Derivative Financial Instruments are separately disclosed in the published financial statements as per the LKAS 39 disclosure requirements. This amount is classified under the other assets category in regulatory reporting. |
|
|
|
Financial Assets Held-For-Trading |
1,216,439 |
53,396,547 |
- |
52,274,531 |
1,122,016 |
Financial Investments - Available-For-Sale are classified as Trading Portfolio under regulatory reporting and accrued interest classified under other assets category. |
|
|
|
Loans and Receivables to Banks |
15,478 |
15,478 |
15,478 |
- |
- |
|
|
|
|
Loans and Receivables to Other Customers |
274,013,970 |
274,195,817 |
241,591,613 |
- |
32,604,204 |
Carrying value of regulatory reporting is as per the Banking Act Direction No. 3 of 2008 Classification of Loans and Advances, Income Recognition and Provisioning. The carrying value of loans and advances in the published financial statements has been subject to impairment provisions as per LKAS 39. |
Measurement techniques and valuation basis of allowance for impairment as per LKAS 39 is explained in detail in note 25.5 to the Financial statements. |
|
|
Financial Investments - Available-For-Sale |
52,620,584 |
- |
- |
- |
- |
Financial Investments - Available-For-Sale are classified as Trading portfolio under regulatory reporting. |
|
|
|
Financial Investments - Held-To-Maturity |
3,524,051 |
24,218,807 |
24,218,807 |
- |
- |
Financial Investments - Loans and receivables are classified as Held to maturity investments (Banking Book)under regulatory reporting and accrued interest classified under other assets category. |
|
|
|
Financial Investments - Loans and receivables |
21,171,508 |
- |
- |
- |
- |
|
||
|
Investments in Subsidiaries |
2,106,021 |
2,106,021 |
488,755 |
- |
1,617,266 |
|
|
|
|
Investments in Associates and Joint Ventures -Held for Sale |
18,526 |
18,526 |
- |
- |
18,526 |
|
|
|
|
Property, Plant and Equipment |
2,356,679 |
2,356,679 |
2,356,679 |
- |
- |
|
|
|
|
Investment Properties |
- |
- |
- |
- |
- |
|
|
|
|
Intangible Assets |
384,369 |
384,369 |
- |
- |
384,369 |
|
|
|
|
Other Assets |
1,693,641 |
4,248,115 |
4,118,453 |
- |
129,662 |
Derivative Financial instruments and the interest receivables on financial assets are included under other assets in regulatory reporting. Unamortized staff costs are included under other assets in the published financial statements. |
Measurement techniques and valuation basis of staff loans are explained in detail under note 35 to the Financial statements. |
|
|
Liabilities |
354,335,206 |
354,181,400 |
- |
- |
- |
|
|
|
|
Due to Banks |
20,236,719 |
- |
- |
- |
|
Due to Banks are classified under other borrowings in regulatory reporting. |
|
|
|
Derivative Financial Instruments |
936,754 |
- |
- |
- |
- |
Derivative Financial Instruments are separately disclosed in the published financial statements as per the LKAS 39 disclosure requirements. This amount is classified in other liabilities category in regulatory reporting. |
|
|
|
Due to Other Customers |
273,369,023 |
267,245,575 |
|
|
|
Due to other customers are at Effective Interest Rate (EIR) method in published financial statements. Accrued interest classified under other liabilities in regulatory reporting. |
Measurement techniques and valuation basis of deposits are at Effective Interest Rate (EIR) method in published financial statements. |
|
|
Debt Securities Issued and Other Borrowed funds |
28,107,045 |
47,794,000 |
|
|
|
Due to Banks balances are classified separately in the published financial statements and interest accrued are classified under other liabilities in the regulatory reporting. |
|
|
|
Tax Liabilities |
1,578,447 |
1,527,312 |
|
|
|
The change in the carrying value is due to tax effects on unrealized gains/losses of available-for-sale investments being accounted in other comprehensive income in the reported published financial statements. |
|
|
|
Deferred Tax Liabilities |
1,371,658 |
1,221,789 |
|
|
|
|
||
|
Employee Benefit Liabilities and Other Liabilities |
9,398,705 |
16,982,221 |
|
|
|
Derivative Financial instruments and the interest payables on financial liabilities are included under other liabilities in regulatory reporting. |
|
|
|
Subordinated Term Debts |
19,336,855 |
19,410,503 |
- |
|
|
Subordinated Term Debts are at Effective Interest Rate (EIR) method in published financial statements. |
Measurement techniques and valuation basis of subordinated term debts are at Effective Interest Rate (EIR) method in published financial statements. |
|
|
Off-Balance Sheet Liabilities |
269,160,399 |
227,080,344 |
262,219,785 |
- |
|
|
|
|
|
Guarantees |
24,121,887 |
24,121,887 |
21,932,717 |
- |
211,263 |
|
|
|
|
Performance Bonds |
8,342,200 |
8,342,200 |
8,273,044 |
- |
69,156 |
|
||
|
Letters of Credit |
13,222,730 |
13,222,730 |
13,212,926 |
- |
9,804 |
|
||
|
Other Contingent Items |
6,768,126 |
6,768,126 |
6,768,126 |
- |
- |
|
|
|
|
Undrawn Commitments |
114,360,796 |
114,360,796 |
114,360,796 |
- |
- |
|
|
|
|
Other Commitments |
102,344,660 |
60,264,605 |
97,672,176 |
- |
- |
|
|
|
|
Shareholders’ Equity |
|
|
|
|
|
|
|
|
|
Equity Capital (Stated Capital)/Assigned Capital |
2,208,520 |
2,208,520 |
|
|
|
|
|
|
|
of which Amount Eligible for CET1 |
2,208,520 |
2,208,520 |
|
|
|
|
|
|
|
of which Amount Eligible for AT1 |
- |
- |
|
|
|
|
|
|
|
Retained Earnings |
18,585,255 |
17,945,565 |
|
|
|
|
|
|
|
Accumulated Other Comprehensive Income |
801,874 |
- |
|
|
|
|
|
|
|
Other Reserves |
7,142,186 |
8,183,447 |
|
|
|
|
|
|
|
Total Shareholders’ Equity |
28,737,835 |
28,337,532 |
|
|
|
|
|
|
BASEL ll CAPITAL ADEQUACY COMPUTATION
The Bank and Group capital adequacy ratios were computed based on Basel II - Pillar I requirements up to the period ended 30 June 2017. Given below are the ratios for the Bank and Group for the year ended 31 December 2016.
The composition of the capital and risk weights assigned to the On and Off Balance Sheet assets, are as prescribed by the Central Bank of Sri Lanka. The Tier I capital of the Bank consists of the stated capital, retained earnings and other reserves after deducting the intangible assets , 50 % of the investments in unconsolidated banking & financial subsidiaries and 50% investments in capital of other banks and financial institutions. The Tier II capital of the Bank includes CBSL approved subordinated term debts, approved revaluation reserve and the general loan loss provision after deducting 50% of the investments in unconsolidated banking & financial subsidiaries and 50% investments in capital of other banks and financial institutions. In arriving the Risk-Weighted Assets (RWA), the Standardized Approach for credit risk , Standardized Measurement Method for market risk and the Basic Indicator Approach for operational risk has been used as per the Basel II guidelines.
|
Capital Base as at 31 December 2016 |
Bank |
Group |
|
|
LKR’ 000 |
LKR’ 000 |
||
|
Tier I : Core Capital |
|||
|
Capital |
1,246,479 |
1,246,479 |
|
|
Statutory reserve fund |
1,246,479 |
1,246,479 |
|
|
Published retained profits |
16,219,170 |
21,246,563 |
|
|
General and other reserves |
5,819,548 |
5,819,548 |
|
|
Minority interests |
- |
1,066,810 |
|
|
Total equity considered for Tier I capital |
24,531,676 |
30,625,879 |
|
|
Deductions - Tier I |
|||
|
Intangible assets |
368,083 |
384,742 |
|
|
50% Investments in unconsolidated banking and financial subsidiaries |
943,850 |
- |
|
|
50% Investments in capital of other banks and financial institutions |
815,997 |
1,133,190 |
|
|
2,127,930 |
1,517,932 |
||
|
Eligible Tier I Capital |
22,403,746 |
29,107,947 |
|
|
Tier II : Supplementary Capital |
|||
|
General loan loss provision |
957,043 |
957,043 |
|
|
Approved revaluation reserve |
542,092 |
542,092 |
|
|
Approved subordinated term debts |
9,009,969 |
9,009,969 |
|
|
10,509,104 |
10,509,104 |
||
|
Deductions - Tier II |
|||
|
50% Investments in unconsolidated banking and financial subsidiaries |
943,850 |
- |
|
|
50% Investments in capital of other banks and financial institutions |
815,997 |
1,133,190 |
|
|
1,759,847 |
1,133,190 |
||
|
Eligible Tier II Capital |
8,749,257 |
9,375,914 |
|
|
Capital Base (Tier I +Tier II) |
31,153,003 |
38,483,861 |
|
|
Assets for Credit risk |
Risk weights |
Risk weighted |
|||
|
BANK |
GROUP |
% |
Bank |
Group |
|
|
LKR’ 000 |
LKR’ 000 |
LKR’ 000 |
LKR’ 000 |
||
|
Cash and claims on Central Government and Central Bank of Sri Lanka |
58,647,311 |
58,649,716 |
0 - 20 |
21,026 |
21,026 |
|
Claims secured by cash deposits, gold and guarantees |
27,339,087 |
27,339,087 |
0 |
- |
- |
|
Claims on Banks |
9,640,933 |
10,166,189 |
20 - 150 |
4,747,626 |
4,995,479 |
|
Claims on Financial Institutions |
18,711,007 |
19,630,437 |
20 - 150 |
10,938,851 |
11,359,196 |
|
Loans secured by residential property |
10,544,601 |
10,544,601 |
50 - 100 |
5,866,613 |
5,866,613 |
|
Past due loans |
2,640,758 |
2,640,758 |
50 - 150 |
3,660,446 |
3,660,446 |
|
Retail claims and corporate claims |
200,783,449 |
202,589,047 |
20 - 150 |
184,402,403 |
186,048,902 |
|
Property, plant and equipment |
2,078,569 |
4,304,255 |
100 |
2,078,569 |
4,304,255 |
|
Other assets |
2,844,721 |
2,788,786 |
100 |
2,844,721 |
2,788,786 |
|
Total Assets considered for Credit Risk |
333,230,436 |
338,652,876 |
214,560,255 |
219,044,703 |
|
Credit Equivalent of Off Balance Sheet Items
|
Principal Amount of |
Credit Conversion Factor |
Credit equivalent Off Balance Sheet Items |
|||
|
BANK |
GROUP |
% |
Bank |
Group |
|
|
LKR’ 000 |
LKR’ 000 |
LKR’ 000 |
LKR’ 000 |
||
|
General guarantees of indebtedness |
16,823,830 |
16,823,830 |
100 |
16,823,830 |
16,823,830 |
|
Stand by letters of credit relating to particular transactions |
67,410 |
67,410 |
50 |
33,705 |
33,705 |
|
Performance bonds and bid bonds |
10,022,804 |
10,022,804 |
50 |
5,011,402 |
5,011,402 |
|
Trade related acceptances and advance documents endorsed |
7,958,256 |
7,958,256 |
20 |
1,591,651 |
1,591,651 |
|
Shipping guarantees |
744,055 |
744,055 |
20 |
148,811 |
148,811 |
|
Documentary letters of credit |
8,338,710 |
8,338,710 |
20 |
1,667,742 |
1,667,742 |
|
Undrawn term loans |
10,799,521 |
10,799,521 |
0, 20 & 50 |
5,398,971 |
5,398,971 |
|
Foreign Exchange contracts |
74,289,101 |
74,289,101 |
2 ,5 & 8 |
2,038,616 |
2,038,616 |
|
Undrawn overdrafts and credit lines |
12,913,230 |
12,847,706 |
0 |
- |
- |
|
Other unutilized facilities |
87,123,064 |
88,098,013 |
0, 20 & 50 |
71,937 |
809,412 |
|
Total |
229,079,981 |
229,989,406 |
32,786,665 |
33,524,140 |
|
|
As at 31 December 2016 |
Bank |
Group |
|||
|
LKR’ 000 |
LKR’ 000 |
||||
|
Capital Charge for Market Risk |
|||||
|
Capital Charge for interest rate risk |
611,745 |
611,745 |
|||
|
Capital Charge for equity securities and unit trusts |
23,038 |
573,135 |
|||
|
Capital Charge for Foreign Exchange and gold |
98,554 |
98,554 |
|||
|
Total capital charge for market risk |
733,337 |
1,283,433 |
|||
|
Total risk-weighted assets equivalent for market risk |
7,333,367 |
12,834,331 |
|||
|
Capital Charge for Operational Risk |
|||||
|
Gross Income |
|||||
|
Year 1 |
11,901,793 |
13,588,231 |
|||
|
Year 2 |
12,237,313 |
13,226,127 |
|||
|
Year 3 |
13,137,571 |
13,600,034 |
|||
|
Average gross income |
12,425,559 |
13,471,464 |
|||
|
Total capital charge for operational risk at 15% |
1,863,834 |
2,020,720 |
|||
|
Total risk weighted assets equivalent for operational risk |
18,638,339 |
20,207,196 |
|||
|
Total Risk Weighted Assets |
240,531,961 |
252,086,230 |
|||
|
Capital Adequacy Ratios as per Basel ll requirements |
|||||
|
Tier I (Required statutory minimum ratio was 5%) |
9.31% |
11.55% |
|||
|
Tier I & Tier II (Required statutory minimum ratio was 10%) |
12.95% |
15.27% |
|||