INVESTOR RELATIONS
AN AWARD WINNING RELATIONSHIP
Investors are our strength and the key stakeholder group which has stood by us through all times. We nurture the relationship we maintain with them in such a manner, that they are well informed of their investment with us.
In recognition of our endeavours to carry out meaningful relations with investors as well as other related stakeholder groups, NDB was recognized as the Gold Award Winner for Best Investor Relations at the CFA Sri Lanka Capital Market Awards 2017, organized by the CFA Sri Lanka Society.
Our investor relations are always based on the principles of quality of disclosures, transparency, and fairness. Furthermore, we do not engage in selective disclosures at any instance and we maintain our relations with investors on a consistent basis irrespective of variations in financial performance.
INVESTOR SUPPORT
We conduct a host of initiatives in keeping the investor and the analyst community well informed of our activities. Given below are such initiatives carried out.
Annual General Meeting
One-to-one investor meetings
Financial statements released to the CSE
Press releases
Investor presentations
Investor transcripts
Email notifications
Local and foreign investor fora
Online investor webinars
Earnings calls
Road shows
Investor relations web page within the Bank’s corporate website
Dedicated communication methods to reach us
Clearly defined Financial results calendars shared in advance for quarterly results releases
1979
Under and by virtue of the National Development Bank of Sri Lank Act No. 2 of 1979 a bank was established with an authorized capital of LKR 2,000 million comprising 20 million ordinary shares of LKR 100.00 each. (which was subsequently subdivided into 200 million ordinary shares of LKR 10.00 each)
1993
61% of the share capital of the National Development Bank of Sri Lanka (NDBSL) was transferred to private ownership through an IPO at LKR 50.00 per share.
1997
NDBSL was privatized further by the early conversion of its convertible debentures, reducing the Governments direct shareholding to 12.2%. A further 2.56% of the issued shares were purchased by NDBSL for an Employees Share Ownership Plan.
2000
A 1:2 bonus issue increased the number of shares in issue to 53,750,000.
2001
As part of its long term plans, NDBSL incorporated a commercial bank under the Companies Act No. 17 of 1982 under the name ‘NDB Bank Limited’ (NBL) to take over the business and operations of ABN Amro NV Colombo Branch.
2005
Pursuant to the provisions of the National Development Bank of Sri Lanka (Consequential Provisions) Act No. 1 of 2005 a company by the name of National Development Bank Limited (NDBL) was incorporated in terms of the Companies Act No. 17 of 1982 (and was accorded with the Registration No. N (PBS) 1252) for the purposes of taking over the business of NDBSL on 15 June 2005 and the National Development Bank of Sri Lanka Act No. 2 of 1979 was repealed except for certain provisions contained therein.
NDBL acquired the business and operations of NBL. In view of this, the shareholders of NBL were issued with shares of NDBL at the ratio of 1 NDBL share for every 5.6 shares of NBL held by them. This resulted in the increase of the issued capital of NDBL to 54,570,257 shares. In order to facilitate this transition, on the date of such acquisition, the Central Bank of Sri Lanka granted a commercial banking license to NDBL whilst withdrawing the specialized banking license that was held by it.
2006
A bonus issue of 1 new share for every 2 shares held increased the issued ordinary share capital of NDBL by 27,285,128 shares.
2007
NDBL was re-registered as National Development Bank PLC (‘Bank’) in terms of the new Companies Act No. 07 of 2007 and accorded with the Registration No. PQ 27.
2010
245,566 ordinary shares were issued to eligible employees as per the Equity Linked Compensation Plan (ELCP) of the Bank, bringing the total number of issued shares to 82,100,951.
2011
Existing ordinary shares were subdivided in the proportion of one new ordinary share for every ordinary share in issue resulting in a total of 164,201,902 ordinary shares in issue.
2013
491,132 ordinary shares were issued on account of share grants of eligible employees in terms of the ELCP to the trustee of ELCP, bringing the total number of issued ordinary shares to 164,693,034.
2014
400,888 shares were issued as share options to eligible employees as per the ELCP, bringing the total to 165,093,922 ordinary shares in issue.
2015
73,420 shares were issued as share options to eligible employees as per the ELCP, bringing the total to 165,167,342 ordinary shares in issue.
2016
18,164 shares were issued as share options to eligible employees as per the ELCP, bringing the total to 165,185,506 ordinary shares in issue.
2017
6,300,199 shares were issued, in a proportion of one scrip issue for every 26.219093 shares held, to the shareholders of the Bank as at 3rd March 2017 by way of a Scrip Dividend (on the basis of LKR 6.00 per share for the existing 165,185,506 issued shares at the time) bringing the total issued share capital to 171,485,705. The stated capital of the Bank as at 31 December 2017 was LKR 2,208,520,000/- The shares of the Bank continue to be quoted on the Colombo Stock Exchange.
SECURITIES IN ISSUE - NDB
-
Ordinary shares
-
Debentures
-
Listed rated unsecured subordinated redeemable debentures issued in December 2013
-
Listed rated unsecured subordinated redeemable debentures issued in June 2015
ORDINARY SHARES
1. Features of Ordinary Shares
Security type |
Quoted ordinary shares |
Listed exchange |
Colombo Stock Exchange (CSE) – Main Board |
Featured stock indices |
All Share Price Index (ASPI) S&P (SL) 20 Index (Adjusted) Bank, Finance & Insurance Index (BFI) |
CSE stock symbol |
NDB.N0000 |
ISIN |
LK0207N0007 |
Bloomberg newswire code |
NDB SL |
Reuters newswire code |
NDB.CM |
2. Analysis of Equity Market Performance and NDB Share Performance - 2017
2.1 Performance of Global Equity Markets
During the year, global equity market performed well amidst the revival in economic activities across the world. Morgan Stanley Capital International (MSCI) world index, a proxy for global equity markets, recorded a gain of 20.1% during 2017 in comparison to a 5.3% gain reported for the year 2016. Emerging market equities outperformed the U.S. broader market index S&P500, which represented one quarter of the global equity market capitalization as at December 2017, where both indices recorded a YoY gain of 34.0% and 19.4% respectively for the year.
The equity markets performances across the world were influenced mainly by a three-time rate hike by the Federal Reserve, tapering the Quantitative Easing (QE) program by the European Central Bank and the disputes witnessed in the Middle Eastern region. However, tax reforms proposed by President Trump’s administration was passed in December 2017, which is expected to boost the performance of the U.S. stock market in 2018. Meanwhile, MSCI frontier index, in which Sri Lanka belongs to, performed exceptionally well with a yearly gain of 27.6% in comparison to a loss of 1.3% in 2016.
2.2 Performance of the Colombo Stock Exchange
The benchmark All Share Price Index (ASPI) recorded a 2.3% gain for the year 2017, compared to a loss of 9.6% in 2016. The tracker of blue chip companies’ price movements, S&P SL 20 Index, also ended the year in a growth trajectory displaying a gain of 5.0% as opposed to 3.5% loss reported in year 2016. Along with the improvements in these indices, the market witnessed an improvement in turnover mainly driven by foreign investor participation. This resulted in a daily average turnover of LKR 915 million during the year, which is a 24.0% YoY increase. Year 2017 witnessed the largest transaction in the last five years’ worth of LKR 10.9 billion on Singer PLC. Net foreign inflow to the Colombo bourse during 2017 surpassed LKR 17.6 billion in comparison to a bleak LKR 384 million recorded a year ago. Renewed foreigners interest in the CSE during the year 2017 was mainly due to IMF’s extended fund facility programme and resulted macro-economic stability coupled with moderately strong local currency (during the year LKR depreciated 2.0% against the USD in comparison to 3.8% depreciation witnessed in year 2016).
Among these improved conditions, CSE raised a cumulative capital of LKR 3.2 billion via four Initial Public Offerings (IPO) during the year. Furthermore, 17 right issues took place raising LKR 45.0 billion compared to LKR 8.7 billion raised in 2016 through 4 right issues. CSE was trading at an attractive valuation amongst emerging markets, where PER and PBV ended at 10.6X and 1.3X respectively in 2017, which is a decline compared to 2016 where PER and PBV ended at 12.4X and 1.4X respectively.
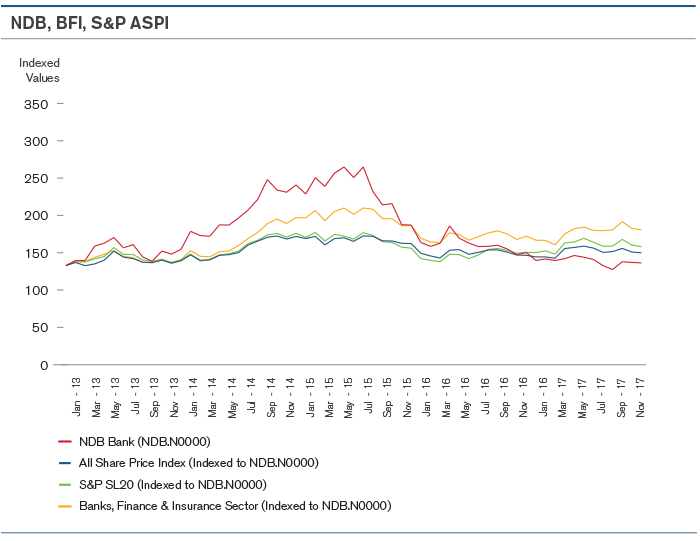
2.3 Performance of the NDB Share
The NDB share price recorded subdued performance compared to the benchmark ASPI & S&P SL20. The share price declined by 9.3% during the year to close at LKR 136.40 by the end of 2017. During 2017, the share reached a high of LKR 152.40 (in May 2017) and a low of LKR 126.90 (in October 2017). A subdued level of activity was seen in NDB share with annual volumes traded during 2017 declining by 30%. During October, a significant level of foreign sales in NDB share was witnessed which resulted in foreigner shareholding of the share reducing to 14.4% at the end of 2017 from 16.5% at the end of 2016.
3 Analysis of Ordinary Shareholders as at 31 December 2017 as per Rule 7.6(x) of the Listing Rules of the CSE.
3.1 Distribution of Shareholders
|
As at 31 December 2017 |
As at 31 December 2016 |
||||||
Shareholding range |
No. of shareholders |
% |
Number of shares |
% |
No. of shareholders |
% |
Number of shares |
% |
1-1,000 |
5,324 |
63.92 |
1,615,455 |
0.94 |
5362 |
66.64 |
1,734,576 |
1.05 |
1,001-10,000 |
2,461 |
29.54 |
7,503,420 |
4.38 |
2219 |
27.58 |
7,068,295 |
4.28 |
10,001-100,000 |
451 |
5.41 |
12,134,104 |
7.08 |
382 |
4.75 |
10,588,434 |
6.41 |
100,001-1,000,000 |
70 |
0.84 |
19,660,614 |
11.46 |
58 |
0.72 |
16,400,419 |
9.93 |
Over 1,000,000 |
24 |
0.29 |
130,572,112 |
76.14 |
25 |
0.31 |
129,393,782 |
78.33 |
Total |
8,330 |
100.00 |
171,485,705 |
100.00 |
8,046 |
100.00 |
165,185,506 |
100.00 |
3.2 Resident/ Non-Resident Shareholding
|
As at 31 December 2017 |
As at 31 December 2016 |
||||||
Shareholding |
No. of shareholders |
% |
Number of shares |
% |
No. of shareholders |
% |
Number of shares |
% |
Resident |
8,192 |
98.34 |
146,805,272 |
85.61 |
7912 |
98.33 |
137,992,077 |
83.54 |
Non-resident |
138 |
1.66 |
24,680,433 |
14.39 |
134 |
1.67 |
27,193,429 |
16.46 |
Total |
8,330 |
100.00 |
171,485,705 |
100.00 |
8,046 |
100.00 |
165,185,506 |
100.00 |
3.3 Individual/ Institutional Shareholding
|
As at 31 December 2017 |
As at 31 December 2016 |
||||||
Shareholding |
No. of shareholders |
% |
Number of shares |
% |
No. of shareholders |
% |
Number of shares |
% |
Individual |
7,855 |
94.30 |
47,877,461 |
27.92 |
7600 |
94.46 |
44,772,715 |
27.10 |
Institutional |
475 |
5.70 |
123,608,244 |
72.08 |
446 |
5.54 |
120,412,791 |
72.90 |
Total |
8,330 |
100.00 |
171,485,705 |
100.00 |
8,046 |
100.00 |
165,185,506 |
100.00 |
4 20 Largest Registered Shareholders of the Bank as at 31 December 2017 as per Rule No/ 7.6(iii) of the Listing Rules of the Colombo Stock Exchange
2017 |
2016 |
||||||
|
Name |
No of Shares |
% |
Name |
No of Shares |
% |
|
1 |
Bank of Ceylon No. 1 Account |
16,995,471 |
9.91 |
Bank of Ceylon No. 1 Account |
16,371,076 |
9.91% |
|
2 |
Employees Provident Fund |
16,620,881 |
9.69 |
Employees Provident Fund |
16,010,248 |
9.69% |
|
3 |
Mr. R. S. Captain |
13,975,641 |
8.15 |
Mr. R. S. Captain |
13,476,049 |
8.16% |
|
4 |
Sri Lanka Insurance Corporation Limited-General Fund |
9,746,566 |
5.68 |
Sri Lanka Insurance Corporation Limited-General Fund |
9,388,488 |
5.68% |
|
5 |
Dr. S. Yaddehige |
8,876,393 |
5.18 |
Dr. S. Yaddehige |
8,550,285 |
5.18% |
|
6 |
Sri Lanka Insurance Corporation Limited-Life Fund |
8,103,126 |
4.73 |
Sri Lanka Insurance Corporation Limited-Life Fund |
7,805,426 |
4.73% |
|
7 |
Perpetual Treasuries Limited |
7,632,593 |
4.45 |
Perpetual Treasuries Limited |
7,352,180 |
4.45% |
|
8 |
Employees Trust Fund Board |
5,932,549 |
3.46 |
Employees Trust Fund Board |
5,714,594 |
3.46% |
|
9 |
Softlogic Life Insurance PLC Account Number 03/Life Shareholders Fund |
5,215,877 |
3.04 |
Softlogic Life Insurance PLC Account Number 03/Life Shareholders Fund |
5,024,252 |
3.04% |
|
10 |
SBI VEN Holdings Pte Limited |
5,190,700 |
3.03 |
SBI VEN Holdings Pte Limited |
5,000,000 |
3.03% |
|
11 |
BNYMSANV RE-CF Ruffer Investment Funds : CF Ruffer Pacific Fund |
5,034,979 |
2.94 |
BNYMSANV RE-CF Ruffer Investment Funds : CF Ruffer Pacific Fund |
4,850,000 |
2.94% |
|
12 |
Hatton National Bank PLC A/C No 1 |
4,445,523 |
2.59 |
Hatton National Bank PLC A/C No 1 |
4,282,200 |
2.59% |
|
13 |
Mr. A. K. Pathirage |
3,083,276 |
1.80 |
HSBC Intl Nom Limited-BBH-Matthews Emerging Asia Fund |
3,374,293 |
2.04% |
|
14 |
CIC Holdings PLC |
2,556,829 |
1.49 |
Mr. A. K. Pathirage |
2,970,000 |
1.80% |
|
15 |
Perpetual Equities (Private) Limited |
2,423,194 |
1.41 |
Perpetual Equities (Private) Limited |
2,839,526 |
1.72% |
|
16 |
Asiri Surgical Hospital PLC |
2,415,219 |
1.41 |
CIC Holdings PLC |
2,462,894 |
1.49% |
|
17 |
Softlogic Life Insurance PLC-A/C No 02 (Life Fund) |
2,242,119 |
1.31 |
Asiri Central Hospitals Limited |
2,403,447 |
1.45% |
|
18 |
DFCC Bank PLC A/C No 1 |
2,076,280 |
1.21 |
Softlogic Life Insurance PLC-A/C No 02 (Life Fund) |
2,159,746 |
1.31% |
|
19 |
Akbar Brothers Pvt Limited A/C No 1 |
1,931,177 |
1.13 |
DFCC Bank PLC A/C No 1 |
2,000,000 |
1.21% |
|
20 |
HSBC Intl Nominees Limited-BP2S London-Aberdeen Asia Smaller Companies Investment Trust |
1,747,189 |
1.02 |
HSBC Intl Nominees Limited-BP2S London-Aberdeen Asia Smaller Companies Investment Trust |
1,683,000 |
1.02% |
|
|
Total |
126,245,582 |
73.62 |
Total |
123,717,704 |
74.90% |
|
5 Public Holding
|
As at 31 December 2017 |
As at 31 December 2016 |
Float adjusted Market Capitalization in LKR million |
20,967 |
22,906 |
Percentage of the shares held by the public |
89.64% |
88.89% |
Number of public shareholders |
8,298 |
8,014 |
Option under which the Bank complies with the minimum Public Holding requirement |
1* |
1* |
* As set out in the Listing Rules of the Colombo Stock Exchange
6 Director’s Interest in Shares of the Bank
Name |
As at 31 December 2017 |
As at 31 December 2016 |
|
No. of shares |
No. of shares |
A W Atukorala |
519 |
500 |
A K Pathirage |
4,145,293* |
3,993,000* |
T L F Jayasekara |
Nil |
Nil |
Mrs. Kimarli Fernando |
Nil |
Nil |
D S P Wikramanayake |
Nil |
Nil |
Mrs. Indrani Sugathadasa |
Nil |
Nil |
D M R Phillips, PC |
Nil |
Nil |
K D W Ratnayaka |
Nil |
Nil |
R Semasinghe (appointed w.e.f. 26/09/2017) |
Nil |
N/A |
P L D N Seneviratne (appointed w.e.f 01/01/2017) |
Nil |
N/A |
Mrs. D M A Harasgama ( resigned w.e.f 30/06/2017) |
N/A |
Nil |
N S Welikala (retired w.e.f 30/04/2017) |
N/A |
Nil |
* includes shares held in the slash account
7 Information on Share Trading
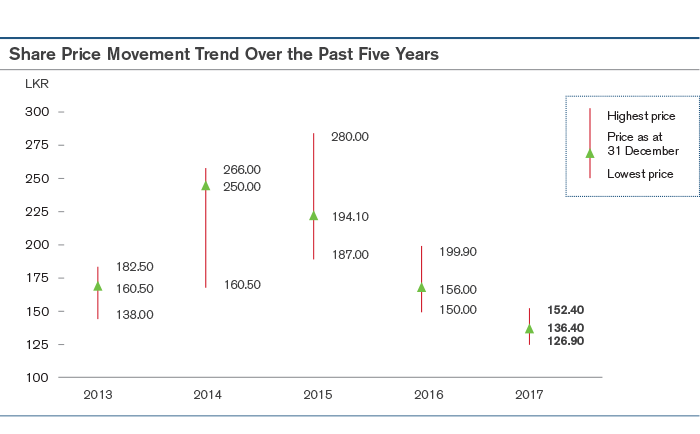
7.1 Share Price Movement Trend Over the Past Five Years
Year |
2017 |
2016 |
2015 |
2014 |
2013 |
Highest price (LKR) |
152.4 |
199.9 |
280.0 |
266.0 |
182.5 |
Date/s highest price was recorded |
15.05.2017 |
03.05.2016 |
23.07.2015 and 22.05.2015 |
03.10.2014 |
10.05.2013 |
Lowest price (LKR) |
126.9 |
150.0 |
187.0 |
160.5 |
138.0 |
Date/s lowest price was recorded |
02.10.2017 |
24.11.2016 |
28.12.2015 |
02.01.2014 |
02.01.2013 |
Price as at 31 December (LKR) |
136.4 |
156.0 |
194.0 |
250.0 |
160.5 |
Total number of shares in issue |
171,485,705 |
165,185,506 |
165,167,342 |
165,093,922 |
164,693,034 |
7.1.1 Share Price Movement Over the Year
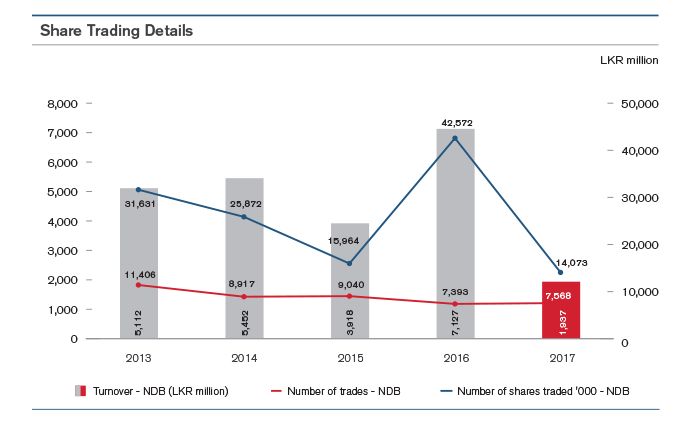
7.2 Share Trading Details
Year |
Jan-17 |
Feb-17 |
Mar-17 |
Apr-17 |
May-17 |
Jun-17 |
Jul-17 |
Aug-17 |
Sep-17 |
Oct-17 |
Nov-17 |
Dec-17 |
Highest price (LKR) |
152.1 |
149.3 |
147.2 |
144.8 |
152.4 |
147.0 |
150.0 |
141.5 |
135.9 |
142.0 |
141.0 |
139.0 |
Lowest price (LKR) |
139.5 |
136.3 |
126.9 |
130.0 |
141.5 |
142.5 |
140.1 |
131.5 |
127.0 |
126.9 |
133.0 |
133.0 |
Price as at month end (LKR) |
139.7 |
141.7 |
139.6 |
142.0 |
146.3 |
144.0 |
140.9 |
132.7 |
127.5 |
137.9 |
137.0 |
136.4 |
7.2 Share Trading Details
Year |
2017 |
Q4 |
Q3 |
Q2 |
Q1 |
2016* |
2015 |
2014 |
2013 |
Number of trades - NDB |
7,568 |
2,459 |
1,610 |
1,541 |
1,958 |
7,393 |
9,040 |
8,917 |
11,406 |
Percentage of total market trades |
0.77% |
0.96% |
0.60% |
0.52% |
1.20% |
0.70% |
0.60% |
0.45% |
0.80% |
Number of shares traded ‘000 - NDB |
14,073 |
6,661 |
1,478 |
2,128 |
3,805 |
42,572 |
15,964 |
25,872 |
31,631 |
Percentage of total shares traded in the market |
0.17% |
0.40% |
0.06% |
0.08% |
0.22% |
0.59% |
0.17% |
0.15% |
0.35% |
Turnover - NDB (LKR million) |
1,937 |
898 |
200 |
307 |
533 |
7,127 |
3,918 |
5,452 |
5,112 |
Average daily turnover (LKR million) |
8 |
15 |
3 |
5 |
9 |
30 |
16 |
23 |
21 |
Percentage of total market turnover |
0.88% |
1.63% |
0.36% |
0.47% |
1.17% |
4.03% |
1.55% |
1.60% |
2.55% |
* As per the latest data available for the year end 31 December 2016 from the Colombo Stock Exchange.
7.3 Shareholder Funds and Market Capitalization
Year |
2017 |
2016 |
2015 |
2014 |
2013 |
Shareholder funds (NDB) in LKR million |
33,012 |
29,937 |
28,382 |
27,876 |
24,514 |
Percentage increase/ decrease in shareholder funds over the prior year |
10% |
5% |
2% |
14% |
(1%) |
Market capitalization (NDB) in LKR million |
23,391 |
25,769 |
32,059 |
41,273 |
26,433 |
Percentage increase/ decrease in NDB market capitalization over the prior year |
(9%) |
(20%) |
(22%) |
56% |
17% |
Market capitalization (CSE) in LKR million |
2,899,291 |
2,745,406 |
2,937,998 |
3,104,864 |
2,459,897 |
Percentage increase/ decrease in CSE market capitalization over the prior year |
5.61% |
(6.56%) |
(5.37%) |
26.22% |
13.49% |
NDB’s market capitalization as a percentage of CSE market capitalization |
0.81% |
0.94% |
1.09% |
1.33% |
1.07% |
Market capitalization rank of NDB in the CSE |
26 |
25 |
21 |
16 |
20 |
Market capitalization (BFI sector within CSE) in LKR million |
769,974.55 |
653,858.18 |
699,843.60 |
753,694.52 |
512,792 |
NDB’s market capitalization as a percentage of BFI sector capitalization |
3.04% |
3.94% |
4.58% |
5.48% |
5.15% |
Beta value of NDB share against ASPI |
1.99 |
1.36 |
1.37 |
1.11 |
0.82 |
Beta value of NDB share against S&P SL20 |
1.15 |
0.92 |
1.54 |
1.10 |
0.63 |
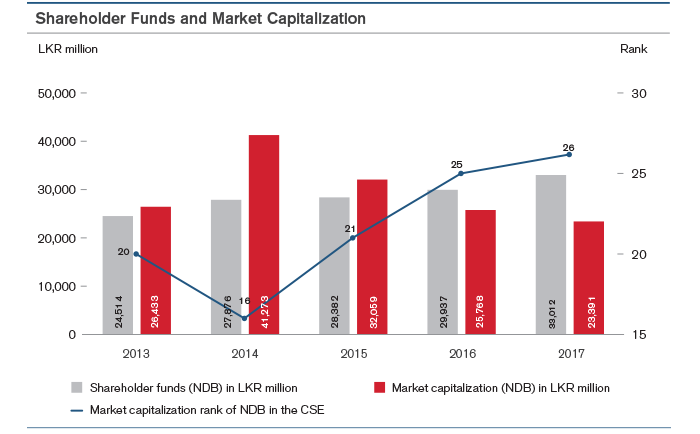
The shareholders’ funds at a Group level stood at LKR 33,012 million as at end 2017. Shareholders’ funds increased by 10% over the prior year. Stated capital increased by LKR 962 million due to scrip dividend paid as a part of the final dividend for the financial year 2016. The scrip dividend resulted in the issuance of 6,300,199 shares. Statutory reserves increased by 7% to LKR 1,336 million, an increment of LKR 90 million. Retained earnings grew by 6% to reach LKR 28,581 million with the transfer of the retained profit portion for 2017. Other reserves recorded a sharp increase of 78% benefiting from mark to mark valuation of available for sale assets and revaluation gains from freehold land and building. In terms of market capitalization, NDB shares’ market cap reduced for a third consecutive year, owing to the reduced share price. The share closed trading at LKR 136.40. The resultant market cap as of the year end was LKR 23,391 million.
7.4 NDB Share Performance in Comparison to Selected Local Indices
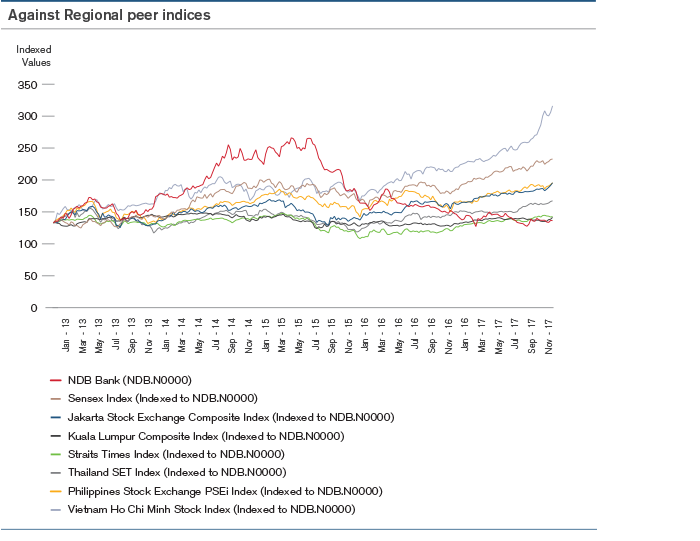
7.5 NDB Share Performance in Comparison to Key Regional Indices
8. Key Shareholder Return Indicators – NDB Group
Year |
2017 |
2016 |
2015 |
2014 |
2013 |
Return on equity (%) |
11.09 |
9.23 |
12.59 |
15.78 |
10.70 |
Gross dividends paid during the year (LKR million) |
1,664 |
661 |
1,815 |
1,978 |
3,222 |
Dividend per share (DPS) (LKR) |
9.00 |
8.00 |
11.00 |
11.00 |
10.00 |
Dividend yield (%) |
6.60 |
5.13 |
5.67 |
4.40 |
6.23 |
Dividend payout ratio (%) - Bank |
35.47 |
41.68 |
51.74 |
53.10 |
21.33* |
Earnings per share (EPS) (LKR) |
20.35 |
15.69 |
21.51 |
25.14 |
16.48 |
Total shareholder return ratio (TSR) (%) |
(6.15) |
(17.57) |
(17.96) |
63.23 |
30.89 |
Price earnings ratio (PE ratio) (Times) |
6.70 |
9.94 |
9.02 |
9.94 |
9.74 |
Net asset value per share (LKR) |
192.51 |
181.23 |
172.35 |
169.35 |
148.85 |
Price to book value (Times) |
0.71 |
0.86 |
1.13 |
1.48 |
1.08 |
Due to one-off equity income of LKR 6,031 million for the year 2013.
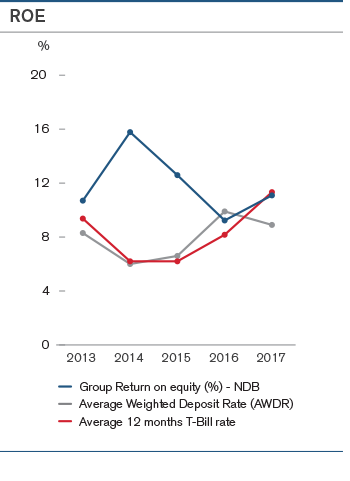
Return on Equity
The Return on Shareholder Funds (ROE) at the Bank level was 16.27%, up from 13.36% in 2016. The Bank ROE was closer to the industry average as of 2017. Group ROE was 11.09%, an increase from 9.23% in 2016.
Earnings per Share (EPS)
Earnings per share (EPS) increased in relation to ROE with the EPS at the Bank level being LKR 25.38 (2016: LKR 18.49) and EPS at the Group level being LKR 20.35 (2016: LKR 15.69). The increase in the EPS is noteworthy within the context of an increased share base during 2017 by 6,300,199 new shares issued as a result of the scrip dividend.
Dividends for the Year
The Bank declared an interim dividend of LKR 2.00 per share in November 2017 for the year ending 31 December 2017. In February 2018 the Bank declared a final dividend of LKR 7.00 per share (being a cash dividend of LKR 2.00 per share and scrip dividend of LKR 5.00 per share) for the year ended 31 December 2017. The dividend declared was in line with the internally set policy guidelines.
The Bank continues to be guided by its Board approved Dividend Policy which stipulates minimum requirements as set out below.
Total Shareholder Returns
Total shareholder returns (TSR), as measured with change in share price and dividends received during the year was a negative 6.15% for 2017. The main reason for the negative movement in the TSR was the drop in NDB’s share price from LKR 156/- in end 2016 to LKR 136.40 by end 2017.
Ratio |
Policy guidelines |
Dividend payout ratio |
>35% |
Capital adequacy |
>12% |
Open loan position |
<40% |
Liquidity |
>20% |
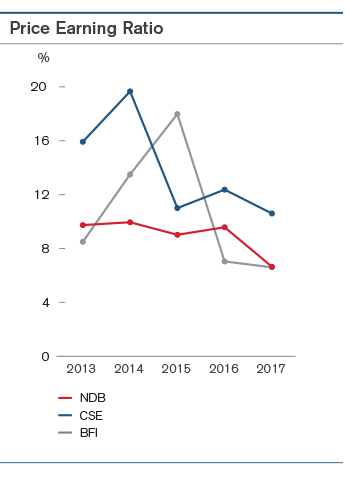
Price Earnings Ratio
The PE ratio of the Group for 2017 was 6.70 times as compared with a PE ratio of 9.94 times of the previous year. CSE and 6.61 times of the Banking, Finance and Insurance sector of the CSE.
Price to Book Value
The Price to Book Value (PBV) dropped below 1 for a second consecutive year due to the dual impact of a reduced share price over the year and an increase in the net assets value per share. Accordingly, the PBV ratio was 0.71 times and compares with a PBV of 0.86 times in 2016.
Net Asset Value per Share
Net asset value per share for 2017 at the Group level was LKR 192.51, an increase from LKR 181.23 from 2016. As with the case of EPS, the increase in the net asset value per share amidst the increase in the share base during 2017 by over 6 million shares is impressive.
9. Employee Share Ownership Schemes
Employee Share Option Scheme (ESOS) and Equity Linked Compensation Plan (ELCP)
An Employee Share Option Scheme (ESOS 2016) was approved by the shareholders of the Bank at an Extraordinary General Meeting (EGM) held in March 2016 in order to, enable the management staff in the rank of Senior Manager and above of the Bank and the respective Chief Executive Officers of NDB Capital Holdings Limited, NDB Wealth Management Limited, NDB Investment Bank Limited and NDB Securities (Private) Limited to take part in the voting ordinary share capital of the Bank, subject to certain limits, terms and conditions.
As per the ESOS 2016, the Bank will offer Share Options relating to voting shares to the eligible employees up to a maximum of 5% of the total number of shares issued by the Bank. The shares under the said scheme shall be issued during a period of five years from the year 2017 (performance year 2016) subject to the performance criteria set out in the Circular to Shareholders dated 1st March 2016, and each year the Share Options will be limited to 1.25% of the total number of shares then issued by the Bank.
Although the scheme commenced in the year 2017, the Bank failed to meet the ‘Qualifying Criteria’ set out in the Circular to Shareholders dated 1st March 2016 and accordingly no shares were issued during the year 2017.
The ELCP previously approved by the shareholders at an EGM held in April 2010 (ELCP 2010), to enable the management staff in the rank of Assistant Vice President and above of the Bank to take part in the voting ordinary share capital of the Bank, was concluded in the year 2014. As per the said ELCP 2010, the eligible members of the staff were able to exercise share options until the year 2017. However no eligible staff members exercised share options during the year 2017, thus effectively concluding the Share Option component of the ELCP approved in the year 2010.
DEBENTURES OF NDB
10. NDB has two listed debentures in issue as follows
I – Rated unsecured subordinated redeemable debentures issued in June 2015
II - Rated unsecured subordinated redeemable debentures issued in December 2013
10 (I) Rated Unsecured Subordinated Redeemable Debentures – June 2015
10 (I) (A) Key Features of the Debentures
Types of debentures |
Debenture Code |
ISIN |
Issue price |
Par value |
Interest rate per annum |
Interest payment frequency |
Annual Effective Rate per annum |
Date of allotment |
Redemption (from the date of allotment) |
Interest payment dates |
Type A |
NDB-BD-24/06/20-C2309-9.4 |
LK0207D23091 |
LKR 100 |
LKR 100 |
9.40% |
Annually |
9.40% |
24-June 2015 |
60 months (5 years) |
31 December |
Type B |
NDB-BD-24/06/20-C2308-0 |
LK0207D23083 |
LKR 63.8136 |
LKR 100 |
9.40% |
Annual compounding on the Issue Price payable on the Date of Redemption |
9.40% |
24-June 2015 |
60 months (5 years) |
At the time of redemption |
10 (I) (B) Trading Details for the Year Ended 31 December 2017
Type of Debenture |
CSE Listing |
Interest payable frequency |
Balance as at 31 December 2017 LKR million |
|
Market Value |
|
Interest Rate |
Interest rate of comparable Security % |
Other ratios as at last trade |
||
|
Highest LKR |
Lowest LKR |
Year end LKR |
Coupon Rate % |
Effective Annual Yield % |
Interest Yield % |
Yield To % |
||||
|
|
|
|||||||||
A - Jun 2015/Jun 2020 |
Listed |
Annually |
7,000 |
87 |
86 |
86 |
9.40 |
9.19 |
8.30 |
16.50 |
16.50 |
B - Jun 2015/Jun 2020 |
Listed |
Payable on date of redemption |
1,914 |
Not traded during the quarter |
9.4 annual compounding on the Issue Price of LKR 63.8136 |
9.18 |
8.30 |
Not traded during the quarter |
|||
Total Debentures |
|
|
8,914 |
|
|
|
|
|
|
|
|
10 (1) (C) Disclosures Regarding the Utilization of Funds as per the Objectives Stated in the Debenture Prospectus
Objective number |
Objective as per Prospectus |
Amount allocated* as per Prospectus in LKR |
Proposed date of utilization as per Prospectus |
Amount allocated from proceeds in LKR (A) |
% of total proceeds |
Amount utilized in LKR (B) |
% of utilization against allocation (B/A) |
Clarification if not fully utilized including where the funds are invested |
1 |
Strengthen the Tier II Capital Base of the Bank and maintain the Capital Adequacy requirements to facilitate future growth of the lending portfolio of the Bank |
10,000,000,000 |
NA |
10,000,000,000 |
100% |
8,914,408,000 |
100% |
- |
2 |
To mobilize/ raise medium term funds to match medium term lending of the Bank |
10,000,000,000 |
NA |
10,000,000,000 |
100% |
10,000,000,000 |
100% |
- |
3 |
To minimize the interest rate risk rate risk and manage the gap exposures of the Bank’s assets and liabilities |
10,000,000,000 |
NA |
10,000,000,000 |
100% |
10,000,000,000 |
100% |
- |
* The face value of the Debentures issued is LKR 10 billion of the total debentures issued, Type B debentures were issued as zero coupon bonds with a face value of LKR100/- per debenture and an issue price of LKR 63.8136. Hence the total proceeds of the debenture is LKR 8,914 million.
10 (II) (A) Key Features of the Debentures
Types of debentures |
Debenture Code |
ISIN |
Issue price |
Par value |
Interest rate per annum |
Interest payment frequency |
Annual Effective Rate per annum |
Date of allotment |
Redemption (from the date of allotment) |
Interest payment dates |
Type A |
NDB/BC/19/12/18A13 |
LK0207D20998 |
LKR 100 |
LKR 100 |
13.00% |
Semi-Annually |
13.42% |
19 December 2013 |
60 months (5 years) |
30 June & 31 December |
Type B |
NDB/BC/19/12/18B13.4 |
LK0207D21012 |
LKR 100 |
LKR 100 |
13.40% |
Annually |
13.40% |
19 December 2013 |
60 months (5 years) |
31 December |
Type C |
NDB/BC/19/12/23C13.9 |
LK0207D21038 |
LKR 100 |
LKR 100 |
13.90% |
Annually |
13.90% |
19 December 2013 |
120 months (10 years) |
31 December |
Type D |
NDB/BC/19/12/25D14 |
LK0207D21053 |
LKR 100 |
LKR 100 |
14.00% |
Annually |
14.00% |
19 December 2013 |
144 months (12 years) |
31 December |
10 (II) (B) Trading Details for the Year Ended 31 December 2017
Type of Debenture |
CSE Listing |
Interest payable frequency |
Balance as at 31 December 2017 LKR million |
|
Market Value |
|
Interest Rate |
Interest rate of comparable Security % |
Other ratios as at last trade |
||
|
Highest LKR |
Lowest LKR |
Year end LKR |
Coupon Rate % |
Effective Annual Yield % |
Interest Yield % |
Yield To Maturity % |
||||
Fixed rate |
|
|
|
|
|
|
|
|
|
|
|
A - Dec 2013/Dec 2018 |
Listed |
Semi annually |
1,243 |
98.03 |
96.00 |
98.03 |
13.00 |
12.79 |
8.30 |
14.77 |
14.77 |
B - Dec 2013/Dec 2018 |
Listed |
Annually |
1,529 |
100.00 |
96.00 |
100.00 |
13.40 |
12.77 |
8.30 |
13.35 |
13.35 |
C - Dec 2013/Dec 2023 |
Listed |
Annually |
3,638 |
86.00 |
86.00 |
86.00 |
13.90 |
13.17 |
9.75 |
17.59 |
17.59 |
D - Dec 2013/Dec 2025 |
Listed |
Annually |
3,590 |
101.07 |
100.04 |
100.04 |
14.00 |
13.26 |
9.75 |
13.99 |
13.99 |
Total Debentures |
|
|
10,000 |
|
|
|
|
|
|
|
|
10 (II) (C) Disclosures Regarding the Utilization of Funds as per the Objectives Stated in the Debenture Prospectus
Objective number |
Objective as per Prospectus |
Amount allocated as per Prospectus in LKR |
Proposed date of utilization as per Prospectus |
Amount allocated from proceeds in LKR (A) |
% of total proceeds |
Amount utilized in LKR (B) |
% of utilization against allocation (B/A) |
Clarification if not fully utilized including where the funds are invested |
1 |
Strengthen the Tier II Capital Base of the Bank and maintain the Capital Adequacy requirements in line with the Bank’s future expansion of operations and the asset base, and facilitate the future expansion of business activities. |
10,000,000,000 |
NA |
10,000,000,000 |
100% |
10,000,000,000 |
100% |
- |
2 |
To mobilize/ raise medium term funds to match medium term lending of the Bank |
10,000,000,000 |
NA |
10,000,000,000 |
100% |
10,000,000,000 |
100% |
- |
3 |
To minimize the interest rate risk rate risk and manage the gap exposures of the Bank’s assets and liabilities |
10,000,000,000 |
NA |
10,000,000,000 |
100% |
10,000,000,000 |
100% |
- |
11. Information on Debentures of the Bank (As per Rule No. 7.6 x (i) of the Listing Rules of the Colombo Stock Exchange
|
2017 |
2016 |
Debt Equity Ratio (%) |
11.87 |
12.19 |
Interest cover (Times) |
1.41 |
1.55 |
Liquidity Assets Ratio (%) – Domestic Banking Unit (Minimum Requirement - 20%) |
22.13 |
21.50 |
Liquidity Assets Ratio (%) – Foreign Currency Banking Unit (Minimum Requirement - 20%) |
24.01 |
22.93 |
Liquidity Coverage Ratio (%) – Rupee (Minimum Requirement - 80%) |
214.35 |
142.53 |
Liquidity Coverage Ratio (%) – All Currency (Minimum Requirement - 80%) |
154.50 |
125.63 |
12. Director’s Interest in Listed Debentures as at 31 December 2017
Name |
Debentures issued in June 2015 |
Debentures issued in December 2013 |
||
As at 31 No of Debentures |
As at 31 No of Debentures* |
As at 31 No of Debentures |
As at 31 No of Debentures |
|
A W Atukorala |
None |
None |
None |
None |
A K Pathirage |
None |
None |
None |
None |
T L F Jayasekara |
None |
None |
None |
None |
Mrs. Kimarli Fernando |
None |
None |
None |
None |
D S P Wikramanayake |
None |
None |
None |
None |
Mrs. Indrani Sugathadasa |
None |
None |
None |
None |
D M R Phillips, PC |
None |
None |
None |
None |
K D W Ratnayaka |
None |
None |
None |
None |
R Semasinghe (appointed w.e.f. 26/09/2017) |
None |
N/A |
None |
N/A |
P L D N Seneviratne |
None |
N/A |
None |
N/A |
Mrs. D M A Harasgama |
N/A |
None |
N/A |
None |
N S Welikala (retired w.e.f 30/04/2017) |
N/A |
None |
N/A |
None |
CREDIT RATINGS OF NDB
13. NDB’s Credit Ratings
The Bank at present engages the services of Fitch Ratings Lanka Limited for local credit ratings and the Bank’s ratings are as follows.
As affirmed in December 2017
National long term rating: A+(lka); Stable outlook
Basel II compliant subordinated term debt: A(lka)
14. Full Rating Reports
Please refer our Investor Relations web page within the NDB corporate website on http://www.ndbbank.com/ to read the full rating reports.
OTHER INFORMATION
15. Financial Statements in United States Dollar (USD)
15.1 Statement of Profit or Loss
|
BANK |
GROUP |
||||||
|
2017 |
2016 |
Change |
2017 |
2016 |
Change |
||
For the year ended 31 December |
USD ’000 |
USD ’000 |
% |
USD ’000 |
USD ’000 |
% |
||
Gross income |
|
278,481 |
226,689 |
23 |
281,737 |
230,062 |
22 |
|
Interest income |
|
243,102 |
194,925 |
25 |
245,083 |
197,257 |
24 |
|
Less: Interest expenses |
|
172,696 |
137,116 |
26 |
172,475 |
136,904 |
26 |
|
Net interest income |
|
70,406 |
57,809 |
22 |
72,608 |
60,353 |
20 |
|
Fee and commission income |
|
16,508 |
15,347 |
8 |
22,373 |
20,748 |
8 |
|
Net gains/(losses) from trading |
|
6,968 |
6,689 |
4 |
6,968 |
6,689 |
4 |
|
Net gains/(losses) from financial investments |
|
3,730 |
1,440 |
159 |
4,805 |
3,002 |
60 |
|
Other operating income |
|
8,173 |
8,288 |
(1) |
2,509 |
2,366 |
6 |
|
Total operating income |
|
105,785 |
89,573 |
18 |
109,262 |
93,157 |
17 |
|
Less: Impairment for loans and receivables and other losses |
|
8,243 |
9,311 |
(11) |
8,451 |
9,703 |
(13) |
|
Net operating income |
|
97,542 |
80,262 |
22 |
100,812 |
83,454 |
21 |
|
Less: operating expenses |
|
|
|
|
|
|
|
|
Personnel expenses |
|
23,652 |
23,393 |
1 |
26,360 |
25,832 |
2 |
|
Other expenses |
|
24,460 |
20,531 |
19 |
27,351 |
22,929 |
19 |
|
Total operating expenses |
|
48,112 |
43,924 |
10 |
53,711 |
48,761 |
10 |
|
Operating profit before tax on financial services |
|
49,431 |
36,338 |
36 |
47,101 |
34,693 |
36 |
|
Less: Tax on financial services |
|
10,135 |
7,138 |
42 |
10,135 |
7,138 |
42 |
|
Operating profit after tax on financial services |
|
39,296 |
29,200 |
35 |
36,966 |
27,555 |
34 |
|
Share of associate companies’ profits/(losses) |
|
- |
- |
- |
- |
- |
- |
|
Profit before taxation |
|
39,296 |
29,200 |
35 |
36,966 |
27,555 |
34 |
|
Less: Taxation |
|
10,796 |
7,606 |
42 |
14,487 |
8,382 |
73 |
|
Profit for the year |
|
28,500 |
21,593 |
32 |
22,479 |
19,173 |
17 |
|
Profit attributable to equity holders of the parent |
|
28,500 |
21,593 |
32 |
22,856 |
18,329 |
25 |
|
Non-controlling interests |
|
- |
- |
- |
(376) |
844 |
(145) |
|
|
|
28,500 |
21,593 |
32 |
22,479 |
19,173 |
17 |
|
Earnings per share basic/diluted (USD) |
|
0.17 |
0.13 |
31 |
0.13 |
0.11 |
18 |
|
Dividend per share (USD) |
|
0.06 |
0.05 |
20 |
- |
- |
- |
|
15.2 Statement of Comprehensive Income
|
BANK |
GROUP |
|
|||||
|
2017 |
2016 |
2017 |
2016 |
|
|||
For the year ended 31 December |
USD ’000 |
USD ’000 |
Change |
USD ’000 |
USD ’000 |
Change |
||
Profit for the year |
28,500 |
21,593 |
32 |
22,479 |
19,173 |
17 |
||
Other comprehensive income |
|
|||||||
Other comprehensive income/ (expenses) to be reclassified to profit or loss in subsequent period |
|
|||||||
Exchange differences on translation of foreign operations |
- |
- |
- |
(2) |
51 |
(105) |
||
Gains/(losses) on remeasuring of available-for-sale investments |
4,249 |
(2,535) |
268 |
3,959 |
(2,972) |
233 |
||
Deferred tax effect on fair value adjustments of available-for-sale investments |
|
(2,019) |
94 |
(2,251) |
(1,953) |
227 |
(962) |
|
Net gains/(losses) on available-for-sale investments |
2,230 |
(2,442) |
191 |
2,005 |
(2,745) |
173 |
||
Gains/(losses) on cash flow hedges |
(461) |
(368) |
(25) |
(461) |
(368) |
(25) |
||
Other comprehensive income/ (expenses) not to be reclassified to profit or loss in subsequent period |
|
|||||||
Revaluation of freehold land and buildings |
2,371 |
- |
100 |
2,476 |
143 |
1,631 |
||
Deferred tax effect on revaluation gains/(losses) |
(1,141) |
- |
(100) |
(1,383) |
- |
(100) |
||
Net gains/(losses) on revaluation of freehold land and buildings |
1,230 |
- |
100 |
1,093 |
143 |
664 |
||
Actuarial gains/(losses) on defined benefit plans |
(651) |
(498) |
(31) |
(649) |
(542) |
(20) |
||
Deferred tax effect on actuarial gains/(losses) |
|
(20) |
72 |
(128) |
(19) |
79 |
(124) |
|
Net actuarial gains/(losses) on defined benefit plans |
(671) |
(426) |
(57) |
(668) |
(463) |
(44) |
||
Total other comprehensive income for the year, net of taxes |
2,329 |
(3,236) |
172 |
1,968 |
(3,382) |
158 |
||
Total comprehensive income for the year |
|
30,829 |
18,358 |
68 |
24,447 |
15,791 |
55 |
|
Attributable to: |
|
|||||||
Equity holders of the parent |
30,829 |
18,358 |
68 |
24,822 |
14,931 |
66 |
||
Non-controlling interests |
- |
- |
- |
(375) |
861 |
(144) |
||
|
30,829 |
18,358 |
68 |
24,447 |
15,791 |
55 |
||
15.3 Statement of Financial Position
BANK |
GROUP |
|
||||||
As at 31 December |
2017 |
2016 |
Change |
2017 |
2016 |
Change |
||
|
USD ’000 |
USD ’000 |
% |
USD ’000 |
USD ’000 |
% |
||
Assets |
|
|
|
|
|
|
|
|
Cash and cash equivalents |
|
34,451 |
33,501 |
3 |
34,901 |
34,308 |
2 |
|
Balances with the Central Bank of Sri Lanka |
|
100,359 |
78,874 |
27 |
100,359 |
78,874 |
27 |
|
Placements with banks |
|
5,491 |
22,011 |
(75) |
5,491 |
22,011 |
(75) |
|
Derivative financial instruments |
|
16,144 |
10,311 |
57 |
16,144 |
10,311 |
57 |
|
Financial assets held-for-trading |
|
7,945 |
5,559 |
43 |
17,374 |
24,443 |
(29) |
|
Loans and receivables to banks |
|
101 |
247 |
(59) |
101 |
247 |
(59) |
|
Loans and receivables to other customers |
|
1,789,771 |
1,519,625 |
18 |
1,790,093 |
1,519,893 |
18 |
|
Financial investments - loans and receivables |
|
138,285 |
280,324 |
(51) |
152,295 |
293,035 |
(48) |
|
Financial investments - available-for-sale |
|
343,701 |
210,281 |
63 |
346,020 |
212,946 |
62 |
|
Financial investments - held-to-maturity |
|
23,018 |
27,621 |
(17) |
26,630 |
33,018 |
(19) |
|
Investments held-for-sale |
|
121 |
124 |
(2) |
218 |
222 |
(2) |
|
Investments in subsidiary companies |
|
13,756 |
14,124 |
(3) |
- |
- |
- |
|
Investments in associate companies |
|
- |
- |
- |
- |
- |
- |
|
Investment property |
|
- |
- |
- |
12,377 |
11,856 |
4 |
|
Intangible assets |
|
2,511 |
2,457 |
2 |
2,593 |
2,568 |
1 |
|
Property, plant & equipment |
|
15,393 |
13,876 |
11 |
19,053 |
16,878 |
13 |
|
Other assets |
|
11,062 |
14,342 |
(23) |
14,858 |
13,968 |
6 |
|
Total assets |
|
2,502,110 |
2,233,276 |
12 |
2,538,507 |
2,274,578 |
12 |
|
Liabilities |
|
|||||||
Due to banks |
|
132,180 |
114,319 |
16 |
132,180 |
114,319 |
16 |
|
Derivative financial instruments |
|
6,119 |
3,169 |
93 |
6,119 |
3,169 |
93 |
|
Due to other customers |
|
1,785,559 |
1,360,925 |
31 |
1,783,419 |
1,358,584 |
31 |
|
Debt securities issued and other borrowed funds |
|
183,586 |
395,416 |
(54) |
183,586 |
395,416 |
(54) |
|
Tax liabilities |
|
10,310 |
5,645 |
83 |
10,288 |
5,691 |
81 |
|
Deferred tax liabilities |
|
8,959 |
5,286 |
70 |
11,734 |
4,972 |
136 |
|
Employee benefit liabilities |
|
2,372 |
2,211 |
7 |
3,005 |
2,635 |
14 |
|
Other liabilities |
|
59,017 |
51,302 |
15 |
59,941 |
52,945 |
13 |
|
Subordinated term debts |
|
126,302 |
129,816 |
(3) |
126,302 |
129,816 |
(3) |
|
Total liabilities |
|
2,314,404 |
2,068,089 |
12 |
2,316,574 |
2,067,547 |
12 |
|
Equity |
|
|||||||
Capital |
|
14,425 |
8,321 |
73 |
14,425 |
8,321 |
73 |
|
Statutory reserve fund |
|
8,729 |
8,321 |
5 |
8,729 |
8,321 |
5 |
|
Retained earnings |
|
159,314 |
146,157 |
9 |
186,683 |
179,883 |
4 |
|
Other reserves |
|
5,238 |
2,388 |
119 |
5,788 |
3,319 |
74 |
|
Total equity to equity holders of the Bank |
|
187,706 |
165,187 |
14 |
215,625 |
199,844 |
8 |
|
Non-controlling interests |
|
- |
- |
- |
6,308 |
7,188 |
(12) |
|
Total equity |
|
187,706 |
165,187 |
14 |
221,933 |
207,031 |
7 |
|
Total liabilities and total equity |
|
2,502,110 |
2,233,276 |
12 |
2,538,507 |
2,274,578 |
12 |
|
Commitments and contingencies |
|
1,758,069 |
1,563,558 |
12 |
1,762,755 |
1,569,629 |
12 |
|
Net Asset Value per share (USD) |
|
1.09 |
1.00 |
9 |
1.26 |
1.21 |
4 |
|
|
|
|
|
|
|
|
|
|
16. Interim Financial Performance
16.1 Statement of Profit or Loss
2017 |
2016 |
|||||||
Bank |
Quarter 4 |
Quarter 3 |
Quarter 2 |
Quarter 1 |
Quarter 4 |
Quarter 3 |
Quarter 2 |
Quarter 1 |
LKR’000 |
31/12/17 |
30/09/17 |
30/06/17 |
31/03/17 |
31/12/16 |
30/09/16 |
30/06/16 |
31/03/16 |
Net interest income |
3,094,516 |
2,909,985 |
2,411,292 |
2,334,329 |
2,243,419 |
2,204,438 |
2,060,538 |
1,978,917 |
Other operating income |
1,034,884 |
1,374,445 |
1,562,003 |
1,430,562 |
1,568,275 |
881,682 |
809,701 |
1,403,833 |
Total operating income |
4,129,400 |
4,284,430 |
3,973,295 |
3,764,891 |
3,811,694 |
3,086,120 |
2,870,239 |
3,382,750 |
Less: impairment charges for loans and |
386,621 |
290,683 |
447,220 |
134,030 |
384,229 |
153,456 |
292,076 |
537,193 |
Net operating income |
3,742,779 |
3,993,747 |
3,526,075 |
3,630,861 |
3,427,465 |
2,932,664 |
2,578,163 |
2,845,557 |
Less: operating expenses |
1,874,293 |
2,128,707 |
1,624,655 |
1,718,380 |
1,624,721 |
1,640,550 |
1,616,026 |
1,567,547 |
Profit from operations |
1,868,486 |
1,865,040 |
1,901,420 |
1,912,481 |
1,802,744 |
1,292,114 |
962,137 |
1,278,010 |
Share of associate companies’ profit |
- |
- |
- |
- |
- |
- |
- |
- |
Profit before taxation |
1,868,486 |
1,865,040 |
1,901,420 |
1,912,481 |
1,802,744 |
1,292,114 |
962,137 |
1,278,010 |
Less: taxation |
(826,391) |
(869,387) |
(746,658) |
(753,355) |
(646,443) |
(553,179) |
(484,412) |
(480,699) |
Profit for the period |
1,042,095 |
995,653 |
1,154,762 |
1,159,126 |
1,156,301 |
738,935 |
477,725 |
797,311 |
Profit attributable to: |
|
|
|
|
|
|
|
|
Equity holders of the parent |
1,042,095 |
995,653 |
1,154,762 |
1,159,126 |
1,156,301 |
738,935 |
477,725 |
797,311 |
Non controlling interests |
- |
- |
||||||
|
1,042,095 |
995,653 |
1,154,762 |
1,159,126 |
1,156,301 |
738,935 |
477,725 |
797,311 |
Basic earnings per share of the quarter (LKR) |
6.08 |
5.80 |
6.73 |
6.76 |
6.74 |
4.30 |
2.78 |
4.64 |
2017 |
2016 |
|||||||
Group |
Quarter 4 |
Quarter 3 |
Quarter 2 |
Quarter 1 |
Quarter 4 |
Quarter 3 |
Quarter 2 |
Quarter 1 |
LKR’000 |
31/12/17 |
30/09/17 |
30/06/17 |
31/03/17 |
31/12/16 |
30/09/16 |
30/06/16 |
31/03/16 |
Net interest income |
3,176,895 |
2,998,196 |
2,491,720 |
2,419,516 |
2,328,677 |
2,297,787 |
2,169,853 |
2,074,973 |
Other operating income |
1,501,741 |
1,572,194 |
1,372,017 |
1,150,692 |
1,368,243 |
1,159,120 |
1,006,897 |
1,271,518 |
Total operating income |
4,678,636 |
4,570,390 |
3,863,737 |
3,570,208 |
3,696,920 |
3,456,907 |
3,176,750 |
3,346,491 |
Less: impairment charges for loans and other losses |
459,016 |
279,146 |
440,620 |
111,515 |
374,700 |
171,008 |
332,943 |
545,923 |
Net operating income |
4,219,620 |
4,291,244 |
3,423,117 |
3,458,693 |
3,322,220 |
3,285,899 |
2,843,807 |
2,800,568 |
Less: operating expenses |
2,108,896 |
2,358,296 |
1,831,595 |
1,902,148 |
1,831,290 |
1,826,287 |
1,778,713 |
1,722,660 |
Profit from operations |
2,110,724 |
1,932,948 |
1,591,522 |
1,556,545 |
1,490,930 |
1,459,612 |
1,065,094 |
1,077,908 |
Share of associate companies’ profit |
- |
- |
- |
- |
- |
- |
- |
- |
Profit before taxation |
2,110,724 |
1,932,948 |
1,591,522 |
1,556,545 |
1,490,930 |
1,459,612 |
1,065,094 |
1,077,908 |
Less: taxation |
(1,235,276) |
(887,046) |
(830,409) |
(806,706) |
(699,300) |
(561,999) |
(509,539) |
(507,749) |
Profit for the period |
875,448 |
1,045,902 |
761,113 |
749,839 |
791,630 |
897,613 |
555,555 |
570,159 |
Profit Attributable to: |
|
|
|
|
|
|
|
|
Equity holders of the parent |
969,808 |
1,034,317 |
748,111 |
737,515 |
726,070 |
881,977 |
535,433 |
547,532 |
Non controlling interests |
(94,360) |
11,585 |
13,002 |
12,324 |
65,560 |
15,636 |
20,122 |
22,627 |
|
875,448 |
1,045,902 |
761,113 |
749,839 |
791,630 |
897,613 |
555,555 |
570,159 |
Basic earnings per share of the quarter (LKR) |
5.65 |
6.03 |
4.36 |
4.30 |
4.23 |
5.14 |
3.12 |
3.19 |
16.2 Statement of Financial Position
2017 |
2016 |
|||||||
Bank |
As at |
As at |
As at |
As at |
As at |
As at |
As at |
As at |
LKR’000 |
31/12/17 |
30/09/17 |
30/06/17 |
31/03/17 |
31/12/16 |
30/09/16 |
30/06/16 |
31/03/16 |
Cash and cash equivalents |
21,480,070 |
20,130,977 |
19,754,135 |
25,833,342 |
20,130,977 |
26,723,081 |
19,647,159 |
23,008,322 |
Net loans and advances |
274,029,448 |
227,676,876 |
252,500,263 |
241,443,635 |
227,676,876 |
222,241,637 |
220,464,118 |
215,736,673 |
Investments |
80,657,129 |
80,597,224 |
85,529,329 |
73,541,811 |
80,597,222 |
72,632,950 |
67,942,445 |
66,224,434 |
Other assets |
6,906,395 |
6,139,658 |
7,028,267 |
6,657,541 |
6,139,657 |
5,720,208 |
6,277,980 |
7,318,040 |
Total |
383,073,042 |
334,544,735 |
364,811,994 |
347,476,329 |
334,544,732 |
327,317,876 |
314,331,702 |
312,287,469 |
|
|
|
|
|
|
|
|
|
Customer deposits |
273,369,023 |
203,866,547 |
239,345,976 |
227,983,883 |
203,866,547 |
193,642,483 |
190,837,894 |
196,903,356 |
Borrowings |
67,680,619 |
95,804,709 |
89,088,257 |
84,793,062 |
95,804,708 |
101,803,282 |
93,116,971 |
84,862,163 |
Other liabilities |
13,285,564 |
10,128,429 |
9,019,907 |
9,088,423 |
10,128,428 |
7,404,401 |
7,192,736 |
8,136,007 |
Shareholders funds |
28,737,837 |
24,745,050 |
27,357,855 |
25,610,961 |
24,745,049 |
24,467,710 |
23,184,101 |
22,385,943 |
Total |
383,073,042 |
334,544,735 |
364,811,994 |
347,476,329 |
334,544,732 |
327,317,876 |
314,331,702 |
312,287,469 |
Net asset value (LKR) |
167.58 |
144.30 |
159.53 |
149.35 |
149.80 |
148.12 |
140.35 |
135.52 |
2017 |
2016 |
|||||||
Group |
As at |
As at |
As at |
As at |
As at |
As at |
As at |
As at |
LKR’000 |
31/12/17 |
30/09/17 |
30/06/17 |
31/03/17 |
31/12/17 |
30/09/17 |
30/06/17 |
31/03/17 |
Cash and cash equivalents |
21,548,918 |
20,251,928 |
19,807,734 |
25,861,744 |
20,251,928 |
26,851,379 |
19,651,235 |
23,200,706 |
Net loans and advances |
274,078,788 |
227,716,971 |
252,465,613 |
241,377,654 |
227,716,971 |
222,268,482 |
220,490,633 |
215,737,783 |
Investments |
83,062,299 |
84,436,804 |
88,461,297 |
76,376,914 |
84,436,802 |
76,359,458 |
71,976,538 |
70,162,269 |
Other assets |
9,955,433 |
8,326,065 |
9,854,881 |
10,114,826 |
8,326,066 |
8,715,345 |
8,757,470 |
9,850,891 |
Total |
388,645,438 |
340,731,768 |
370,589,525 |
353,731,138 |
340,731,767 |
334,194,664 |
320,875,876 |
318,951,650 |
|
|
|
|
|
|
|
|
|
Customer deposits |
273,041,417 |
203,515,828 |
238,962,998 |
227,471,975 |
203,515,828 |
193,348,373 |
190,447,984 |
196,510,148 |
Borrowings |
67,680,619 |
95,804,709 |
89,088,257 |
84,793,062 |
95,804,708 |
101,803,282 |
93,116,971 |
84,903,033 |
Other liabilities |
13,945,429 |
10,397,935 |
9,768,787 |
10,070,605 |
10,397,934 |
7,931,796 |
7,629,975 |
8,698,974 |
Shareholders funds |
33,012,228 |
29,936,587 |
31,707,581 |
30,346,717 |
29,936,588 |
30,083,207 |
28,659,549 |
27,796,707 |
Non controlling interests |
965,745 |
1,076,709 |
1,061,902 |
1,048,779 |
1,076,709 |
1,028,006 |
1,021,397 |
1,042,789 |
Total |
388,645,438 |
340,731,768 |
370,589,525 |
353,731,138 |
340,731,767 |
334,194,664 |
320,875,876 |
318,951,650 |
Net asset value (LKR) |
192.51 |
174.57 |
184.90 |
176.96 |
181.23 |
182.12 |
173.50 |
168.27 |
17. Ten Years at a Glance
17.1 Statement of Profit or Loss - Group
LKR million |
2007 |
2008 |
2009 |
2010 |
2011 |
2012 |
2013 |
2014 |
2015 |
2016 |
2017 |
Income |
|||||||||||
Net interest income |
3,522 |
3,787 |
4,233 |
4,163 |
4,910 |
5,896 |
7,012 |
7,913 |
7,807 |
8,861 |
11,086 |
Other operating income |
1,474 |
1,662 |
2,560 |
2,785 |
3,012 |
9,042 |
4,537 |
5,053 |
5,484 |
4,816 |
5,597 |
Total operating income |
4,997 |
5,449 |
6,793 |
6,948 |
7,922 |
14,938 |
11,549 |
12,966 |
13,291 |
13,677 |
16,683 |
Impairment for loans & receivables and other losses |
65 |
116 |
373 |
(172) |
(88) |
51 |
1,261 |
529 |
746 |
1,425 |
1,290 |
Net operating income |
4,932 |
5,333 |
6,420 |
7,119 |
8,010 |
14,887 |
10,288 |
12,437 |
12,545 |
12,252 |
15,393 |
Less operating expenses |
|||||||||||
Personnel costs |
949 |
1,151 |
1,300 |
1,567 |
2,118 |
2,333 |
2,660 |
3,172 |
3,634 |
3,793 |
4,025 |
Other operating costs |
1,104 |
1,237 |
1,370 |
1,496 |
1,863 |
2,163 |
2,904 |
2,738 |
3,196 |
3,366 |
4,176 |
Total operating expenses |
2,053 |
2,388 |
2,670 |
3,063 |
3,981 |
4,496 |
5,564 |
5,911 |
6,830 |
7,159 |
8,201 |
Operating Profit Before Share of Associate |
|||||||||||
Co’s Profit Before Tax |
2,879 |
2,945 |
3,750 |
4,056 |
4,030 |
10,391 |
4,724 |
6,527 |
5,715 |
5,094 |
7,192 |
Share of associate co’s profit |
179 |
172 |
526 |
295 |
331 |
439 |
49 |
97 |
78 |
- |
- |
Profit before taxation |
3,058 |
3,118 |
4,276 |
4,351 |
4,361 |
10,830 |
4,773 |
6,624 |
5,793 |
5,094 |
7,192 |
Taxation |
(1,421) |
(1,409) |
(2,154) |
(2,175) |
(1,597) |
(1,898) |
(2,061) |
(2,378) |
(2,123) |
(2,279) |
(3,759) |
Profit after taxation |
1,637 |
1,708 |
2,121 |
2,176 |
2,764 |
8,932 |
2,712 |
4,246 |
3,670 |
2,815 |
3,432 |
Minority interest |
(115) |
(103) |
(37) |
(73) |
(235) |
(78) |
(70) |
(112) |
(128) |
(124) |
57 |
Profit attributable to group |
1,521 |
1,605 |
2,085 |
2,103 |
2,528 |
8,854 |
2,642 |
4,134 |
3,542 |
2,691 |
3,490 |
17.2 Statement of Financial Position - Group
LKR million |
2007 |
2008 |
2009 |
2010 |
2011 |
2012 |
2013 |
2014 |
2015 |
2016 |
2017 |
Assets |
|||||||||||
Liquid Assets |
7,748 |
5,883 |
8,243 |
5,586 |
7,651 |
13,269 |
8,139 |
12,737 |
20,002 |
20,252 |
21,549 |
Investments |
14,701 |
18,509 |
32,128 |
20,021 |
27,359 |
32,499 |
55,614 |
72,971 |
77,257 |
84,437 |
83,062 |
Loans & Advances |
49,818 |
54,589 |
54,107 |
78,452 |
102,019 |
124,311 |
137,523 |
175,547 |
209,768 |
227,717 |
274,079 |
Investments in Associate Companies |
1,210 |
1,393 |
1,724 |
1,763 |
1,797 |
33 |
77 |
- |
- |
- |
- |
Property & Equipment |
804 |
781 |
806 |
918 |
1,504 |
1,541 |
1,473 |
2,550 |
2,730 |
2,913 |
3,314 |
Investment Property |
1,200 |
1,200 |
1,200 |
1,200 |
1,296 |
1,296 |
1,384 |
1,546 |
1,672 |
1,776 |
1,895 |
Other Assets |
661 |
925 |
1,075 |
691 |
962 |
1,154 |
2,608 |
3,780 |
3,925 |
3,637 |
4,747 |
Total Assets |
76,143 |
83,280 |
99,286 |
108,635 |
142,588 |
174,103 |
206,818 |
269,130 |
315,354 |
340,732 |
388,645 |
Liabilities |
|||||||||||
Borrowings |
34,147 |
34,993 |
29,561 |
28,631 |
38,973 |
36,630 |
47,344 |
80,768 |
92,331 |
96,279 |
68,617 |
Deposits with Customers |
25,624 |
31,091 |
49,948 |
60,533 |
82,094 |
107,394 |
129,423 |
151,485 |
184,152 |
203,516 |
273,041 |
Taxation |
522 |
352 |
560 |
633 |
397 |
713 |
625 |
1,416 |
1,237 |
1,597 |
3,372 |
Other Liabilities |
2,750 |
3,614 |
4,334 |
2,826 |
3,286 |
3,657 |
4,062 |
6,662 |
8,233 |
8,326 |
9,637 |
Total Liabilities |
63,043 |
70,050 |
84,403 |
92,623 |
124,750 |
148,394 |
181,454 |
240,331 |
285,953 |
309,718 |
354,667 |
Shareholders’ Funds |
|||||||||||
Stated Capital |
1,033 |
1,033 |
1,033 |
864 |
864 |
864 |
944 |
1,145 |
1,163 |
1,246 |
2,209 |
Statutory Reserves |
819 |
819 |
819 |
879 |
879 |
879 |
959 |
1,011 |
1,243 |
1,246 |
1,336 |
Other Reserves |
- |
- |
- |
- |
387 |
924 |
1,880 |
1,474 |
1,000 |
497 |
886 |
Retained Earnings |
9,833 |
10,811 |
12,345 |
13,552 |
14,796 |
22,216 |
20,733 |
24,246 |
24,976 |
26,946 |
28,581 |
Total Shareholders’ Funds |
11,685 |
12,662 |
14,197 |
15,295 |
16,926 |
24,883 |
24,516 |
27,876 |
28,382 |
29,937 |
33,012 |
Minority Interest |
1,415 |
568 |
687 |
717 |
913 |
826 |
848 |
923 |
1,019 |
1,077 |
966 |
Total Funds Employed |
13,100 |
13,230 |
14,883 |
16,012 |
17,838 |
25,709 |
25,364 |
28,799 |
29,401 |
31,013 |
33,978 |
Total Liabilities & Funds Employed |
76,143 |
83,280 |
99,286 |
108,635 |
142,588 |
174,103 |
206,818 |
269,130 |
315,354 |
340,732 |
388,645 |
17.3 Share Information - Group
LKR million |
2007 |
2008 |
2009 |
2010 |
2011 |
2012 |
2013 |
2014 |
2,015 |
2,016 |
2,017 |
Share Information |
|||||||||||
Market Price per Share ( LKR) |
170.00 |
86.00 |
206.00 |
174.50 |
138.10 |
138.10 |
161.50 |
250.00 |
194.10 |
156.00 |
136.40 |
Basic Earnings per Share (LKR) - Group |
9.30 |
9.80 |
12.75 |
12.81 |
15.79 |
55.31 |
16.48 |
25.14 |
21.51 |
15.69 |
20.35 |
Interim Dividends per Share (LKR) |
- |
- |
- |
4.00 |
3.50 |
5.00 |
5.00 |
7.00 |
7.00 |
- |
2.00 |
Final Dividends per Share (LKR) |
6.00 |
6.75 |
8.00 |
4.50 |
4.00 |
10.00 |
5.00 |
4.00 |
4.00 |
8.00 |
7.00 |
Total Dividends per Share (LKR) |
6.00 |
6.75 |
8.00 |
8.50 |
7.50 |
15.00 |
10.00 |
11.00 |
11.00 |
8.00 |
9.00 |
Dividend Cover (Times) |
3.72 |
3.27 |
3.77 |
2.19 |
2.05 |
3.69 |
1.65 |
2.29 |
1.96 |
1.96 |
2.26 |
Price Earnings Ratio (Times) |
9.14 |
4.39 |
8.08 |
13.63 |
8.97 |
2.56 |
9.74 |
9.94 |
9.02 |
9.94 |
6.70 |
Book Value per Share (LKR) |
71.38 |
77.35 |
86.72 |
93.15 |
103.08 |
151.54 |
148.85 |
169.35 |
172.35 |
181.23 |
192.51 |
18. Compliance Report in Terms of Section 7.6 – Contents of the Annual Report in Terms of the Listing Rules of the Colombo Stock Exchange.
Tabulated below is how we complied with the Contents of the Annual Report as specified in Section 7.6 of the Listing Rules issued by the Colombo Stock Exchange. The table provides the disclosure requirements of Section 7.6, the compliance level of the Bank and where you will find the respective disclosures within this Annual Report.
Rule No: |
Disclosure Requirement |
Cross Reference/ within the Report (page/s) |
7.6 (i) |
Names of persons who during the financial year were directors of the Entity. |
190-197 |
7.6 (ii) |
Principal activities of the Entity and its subsidiaries during the year and any changes therein. |
302 |
7.6 (iii) |
The names and the number of shares held by the 20 largest holders of voting and non-voting shares and the percentage of such shares held. |
116 |
7.6 (iv) |
The float adjusted market capitalization, public holding percentage (%), number of public shareholders and under which option the Listed Entity complies with the Minimum Public Holding requirement. |
116 |
7.6 (v) |
A statement of each director’s holding and Chief Executive Officer’s holding in shares of the Entity at the beginning and end of each financial year. |
117 |
7.6 (vi) |
Information pertaining to material foreseeable risk factors of the Entity. |
264 |
7.6 (vii) |
Details of material issues pertaining to employees and industrial relations of the Entity. |
264 |
7.6 (viii) |
Extents, locations, valuations and the number of buildings of the Entity’s land holdings and investment properties. |
340 and 343 |
7.6 (ix) |
Number of shares representing the Entity’s stated capital. |
260 |
7.6 (x) |
A distribution schedule of the number of holders in each class of equity securities, and the percentage of their total holdings in the following categories: |
115 |
7.6 (xi) |
The following ratios and market price information: |
119 and 125 |
7.6 (xii) |
Significant changes in the Entity’s or its subsidiaries’ fixed assets and the market value of land, if the value differs substantially from the book value; |
N/A |
7.6 (xiii) |
If during the year the Entity has raised funds either through a public issue, Rights Issue, and private placement; |
N/A |
7.6 (xiv) |
a. Employee Share Option Schemes |
122 |
|
b. Employee Share Purchase Schemes |
N/A |
7.6 (xv) |
Disclosures pertaining to Corporate Governance practices in terms of Rules 7.10.3, 7.10.5 c. and 7.10.6 c. of Section 7 of the Rules. |
207 to 259 |
7.6 (xvi) |
Related Party transactions exceeding 10% of the Equity or 5% of the total assets of the Entity as per Audited Financial Statements, whichever is lower |
371 to 376 |
19. Shareholder Inquiries and Communications
Please refer Corporate Information on page 438.
© Designed and Developed by Triad Digital