FINANCIAL HIGHLIGHTS 2017
|
Bank |
Group |
||||
|
2017 |
2016 |
Change |
2017 |
2016 |
Change |
|
LKR ‘000 |
LKR ‘000 |
% |
LKR ‘000 |
LKR ‘000 |
% |
Operating results for the year |
|
|
|
|
|
|
Gross income |
42,520,594 |
33,281,736 |
28 |
43,017,759 |
33,776,905 |
27 |
Operating profit before tax on financial services |
7,547,420 |
5,335,004 |
41 |
7,191,740 |
5,093,546 |
41 |
Taxation |
3,195,791 |
2,164,733 |
48 |
3,759,437 |
2,278,587 |
65 |
Profit for the year |
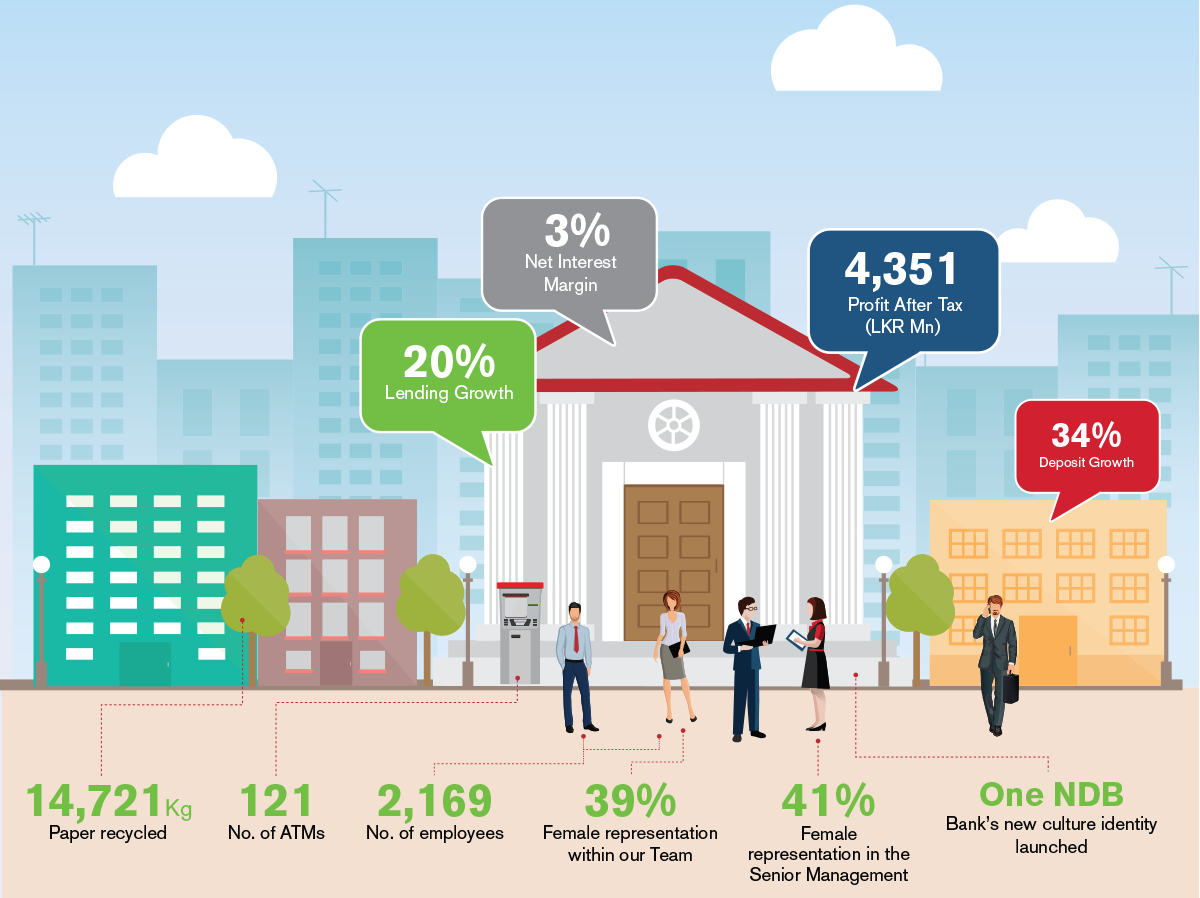
4,351,629 |
3,170,271 |
37 |
3,432,303 |
2,814,959 |
22 |
Profit attributable to equity holders of the parent |
4,351,629 |
3,170,271 |
37 |
3,489,752 |
2,691,014 |
30 |
Gross dividends for the year |
1,543,371 |
1,321,484 |
17 |
1,543,371 |
1,321,484 |
17 |
Revenue to government |
3,145,376 |
2,081,000 |
51 |
3,264,294 |
2,233,854 |
46 |
Assets and liabilities |
|
|
|
|
|
|
Due to other Customers |
273,369,023 |
203,866,547 |
34 |
273,041,417 |
203,515,828 |
34 |
Loans and receivables |
274,029,448 |
227,676,876 |
20 |
274,078,788 |
227,716,971 |
20 |
Total assets |
383,073,042 |
334,544,735 |
15 |
388,645,438 |
340,731,768 |
14 |
Total liabilities |
354,335,207 |
309,799,685 |
14 |
354,667,465 |
309,718,472 |
15 |
Total equity to equity holders of the Bank |
28,737,835 |
24,745,050 |
16 |
33,012,227 |
29,936,587 |
10 |
Profitability (%) |
|
|
|
|
|
|
Net interest margin |
3.00 |
2.64 |
13 |
3.04 |
2.70 |
13 |
Non-performing loans ratio |
1.83 |
2.63 |
(30) |
1.83 |
2.63 |
(30) |
Return on assets |
1.21 |
0.99 |
23 |
0.96 |
0.82 |
17 |
Return on equity |
16.27 |
13.36 |
22 |
11.09 |
9.23 |
20 |
Total leverage (times) |
13.33 |
13.52 |
(1) |
11.77 |
11.38 |
3 |
Cost to income ratio |
45.48 |
49.04 |
(7) |
49.16 |
52.34 |
(6) |
Investor information (LKR) |
|
|
|
|
|
|
Net asset value per share |
167.58 |
149.80 |
12 |
192.51 |
181.23 |
6 |
Market value per share - as at 31 December |
136.40 |
156.00 |
(13) |
NA |
NA |
- |
Earnings per share - basic/diluted |
25.38 |
18.49 |
37 |
20.35 |
15.69 |
30 |
Price earnings (times) |
5.37 |
8.44 |
(36) |
NA |
NA |
- |
Dividend per share |
9.00 |
8.00 |
13 |
NA |
NA |
- |
Dividend cover (times) |
2.82 |
2.31 |
22 |
NA |
NA |
- |
Dividend yield (%) |
6.60 |
5.13 |
29 |
NA |
NA |
- |
Market capitalization (LKR' 000) |
23,390,650 |
25,768,939 |
(9) |
NA |
NA |
- |
Regulatory ratios (%) |
|
|
|
|
|
|
Capital adequacy ratios* |
|
|
|
|
|
|
Common Equity Tier 1 Capital Ratio |
8.85 |
N/A |
- |
10.49 |
N/A |
- |
Tier 1 Capital Ratio (Minimum Requirement - 7.25%) |
8.85 |
9.31 |
(5) |
10.49 |
11.55 |
(9) |
Total Capital Ratio (Minimum Requirement - 11.25%) |
13.89 |
12.95 |
7 |
15.18 |
15.27 |
(1) |
Statutory liquid assets ratio (%) |
||||||
DBU (Minimum Requirement - 20%) |
22.13 |
21.50 |
3 |
N/A |
N/A |
- |
FCBU (Minimum Requirement - 20%) |
24.01 |
22.93 |
5 |
N/A |
N/A |
- |
Liquidity coverage ratio (%) |
|
|
|
|
|
|
Rupee (Minimum Requirement - 80%) |
214.35 |
142.53 |
50 |
N/A |
N/A |
- |
All Currency (Minimum Requirement - 80%) |
154.50 |
125.63 |
23 |
N/A |
N/A |
- |
* Capital adequacy ratios for 2016 are stated in accordance with the Basel II guidelines.
Financial goals and achievements
|
Goals |
Achievements |
||||
2017 |
2016 |
2015 |
2014* |
2013* |
||
Financial indicators - Bank |
||||||
Return on Assets (%) |
Over 1.5% |
1.21 |
0.99 |
1.23 |
1.47 |
1.14 |
Return on equity (%) |
Over 17% |
16.27 |
13.36 |
15.63 |
16.33 |
14.38 |
Growth in total operating income (%) |
Over 20% |
22.82 |
7.71 |
4.69 |
19.00 |
11.55 |
Growth in profit after taxation (%) |
Over 20% |
37.26 |
(9.72) |
2.73 |
64.00 |
(29.00) |
Growth in total assets (%) |
Over 15% |
14.51 |
8.21 |
17.67 |
31.00 |
23.00 |
Dividend per share (LKR) |
LKR 8 Per Share |
9.00 |
8.00 |
11.00 |
11.00 |
10.00 |
Capital adequacy ratios: |
||||||
Common Equity Tier 1 Capital Ratio - (Minimum Requirement - 5.75%) |
Over 8% |
8.85 |
NA |
NA |
NA |
NA |
Total Tier 1 Capital Ratio - (Minimum requirement - 7.25%) |
Over 8% |
8.85 |
9.31 |
8.51 |
10.09 |
12.05 |
Total Capital Ratio - (Minimum requirement - 11.25%) |
Over 12% |
13.89 |
12.95 |
12.59 |
14.68 |
17.87 |
* The above achievements are presented excluding the one-off equity income of LKR 6,031 million for the year 2013.
PERFORMANCE HIGHLIGHTS 2017
2017 |
2016 |
Change (%) |
|||
Human Capital |
No. of employees |
2,169 |
2,109 |
2.84 |
|
New recruits |
423 |
445 |
-5 |
||
Turnover rate (%) |
9.3 |
6.6 |
- |
||
Female representation-overall (%) |
39 |
39 |
- |
||
Female representation-senior management (%) |
41 |
41 |
- |
||
Payments to employees (LKR million) |
3,611 |
3,435 |
5 |
||
Workplace injuries |
0 |
1 |
- |
||
Revenue per employee (LKR million) |
7.45 |
6.24 |
19 |
||
Profit before tax per employee (LKR million) |
3.48 |
3.06 |
14 |
||
Social and Relationship Capital |
Funds Disbursed to SME and Micro (LKR million) |
44.47 |
39.85 |
11.5 |
|
SME and Micro Finance lending outside the Western province (%) |
48 |
48 |
- |
||
Correspondent Relationships |
94 |
94 |
- |
||
Incidents of non-compliance with laws and regulations (No. of) |
0 |
0 |
- |
||
Payments to suppliers (LKR million) |
3,029 |
2,339 |
29 |
||
Manufactured Capital |
Capital expenditure (LKR million) |
588 |
871 |
-32 |
|
No. of branches |
107 |
104 |
- |
||
No. of ATMs |
121 |
115 |
- |
||
New branches opened during the year |
3 |
11 |
- |
||
Natural Capital |
Electricity consumption (kwH) |
5,864,560 |
5,864,988 |
- |
|
Paper consumption (kg) |
49,493 |
46,017 |
8 |
||
Paper recycled (%) |
30 |
48 |
- |